
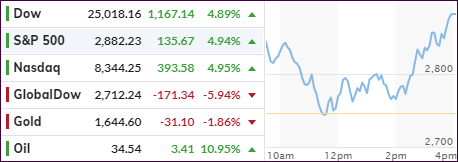
[Chart courtesy of MarketWatch.com]
- Moving the markets
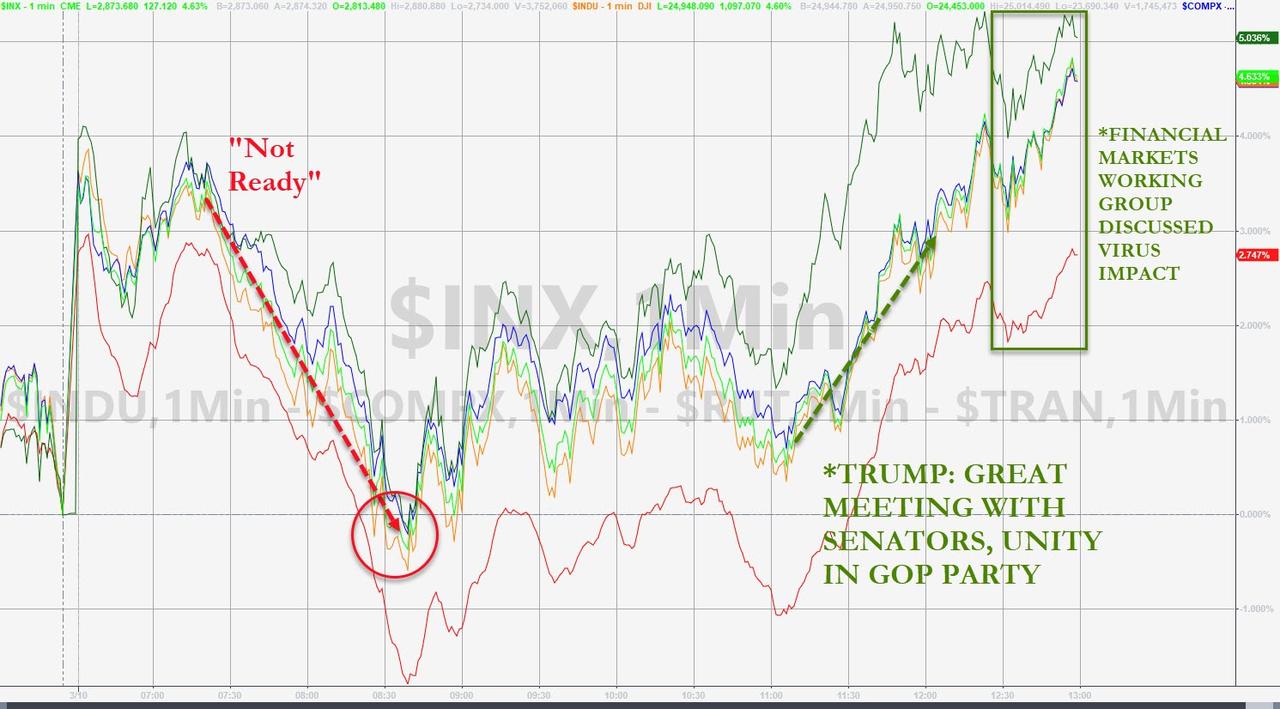
Another wild roller-coaster day in the markets had the Dow up 900 points early on, after which it tanked and dipped into negative territory but then went on to rebound and reached new highs for the day, after a last hour pump, as this chart demonstrates.
Not that any current issues were resolved but hope for a fiscal response to the coronavirus scare lifted overall spirits with an assist by Trump’s proposal for a payroll tax cut.
Historically, today’s rebound is not unusual, as Bespoke Investment Group strategists found that in the 10 previous times since 1952, that the S&P 500 fell 5% or more on a Monday, the index has gained the following day by an average of 4.2%.
While that is noteworthy, it does not imply that the bear market is over, and all is well again. As officialdom scrambles to come up with solutions, Trump’s overture to seek payroll tax relief and other measure to help businesses deal with the virus problem, may be a step in the right direction and had at least a momentary calming effect on the markets.
Right now, to me this is nothing more than a one-day bounce, and we will need a lot more to see this move as sustainable and leading to a new bull run. Technically speaking, the damage lingers with all major indexes remaining below their 200-day averages.
Fundamentally speaking, the Dow has a long way to catch down to earnings, as Bloomberg posted here.
While bond yields managed to surge back to the breakeven point of last Friday’s close, with the 10-year gaining 22 basis points to close at 0.792%, the untold story lies in the overnight lending market, where the financial plumbing continues to break and the funding freeze is getting worse.
As I posted before, this is a very complex subject, so suffice it to say that dealers demanded a record $216 billion in liquidity from the Fed repo—for one day! ZH summed it up like this:
As we pointed out last week, this continuing liquidity crunch is not only bizarre, but increasingly concerning, as it means that not only did the rate cut not unlock additional funding, it actually made the problem worse, and now banks and dealers are telegraphing that they need not only more repo buffer but likely an expansion of QE… which will come soon enough, once the Fed funds hits 0% in a few days and is forced to restart bond buying to prevent the next crash.
If these issues are not resolved, the next disaster is bound to start in the bond market, and if it does, it will certainly affect the equity markets in a big way to the downside.
This is not the time to be a hero by engaging in the fine art of bottom fishing.
2. ETFs in the Spotlight
In case you missed the announcement and description of this section, you can again.
It features 10 broadly diversified and sector ETFs from my HighVolume list as posted every Saturday. Furthermore, they are screened for the lowest MaxDD% number meaning they have been showing better resistance to temporary sell offs than all others over the past year.
The below table simply demonstrates the magnitude with which some of the ETFs are fluctuating regarding their positions above or below their respective individual trend lines (%+/-M/A). A break below, represented by a negative number, shows weakness, while a break above, represented by a positive percentage, shows strength.
For hundreds of ETF choices, be sure to reference Thursday’s StatSheet.
For this past domestic “Buy” cycle, which ended on 2/27/2020, here’s how some our candidates have fared:
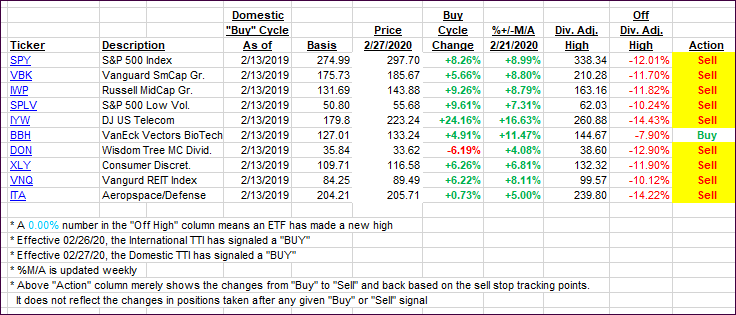
Click image to enlarge
Again, the %+/-M/A column above shows the position of the various ETFs in relation to their respective long-term trend lines, while the trailing sell stops are being tracked in the “Off High” column. The “Action” column will signal a “Sell” once the -8% point has been taken out in the “Off High” column. For more volatile sector ETFs, the trigger point is -10%.
3. Trend Tracking Indexes (TTIs)
Our TTIs recovered but remain stuck in bearish territory.
Here’s how we closed 03/10/2020:
Domestic TTI: -10.41% below its M/A (prior close -14.53%)—Sell signal effective 02/27/2020
International TTI: -12.61% below its M/A (prior close -14.09%)—Sell signal effective 02/26/2020
Disclosure: I am obliged to inform you that I, as well as my advisory clients, own some of the ETFs listed in the above table. Furthermore, they do not represent a specific investment recommendation for you, they merely show which ETFs from the universe I track are falling within the specified guidelines.
Contact Ulli