
[Chart courtesy of MarketWatch.com]
- Moving the markets
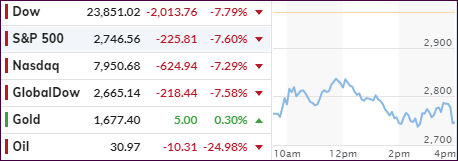
Watching the oil and market destructions in the future’s last night, I had a pretty good idea as to what was in store for today. The Dow plunged 2,000 points, while other indexes were down over 6% with the S&P 500 locked limit down at -5% and tumbling to -7.60% after the regular session ended.
Here are the circuit breaker rules:
- If the S&P 500 declines 7%, (208 points), trading will pause for 15 min
- If declines 13%, (386 pts) trading will again pause for 15 mins
- If falls 20%, (594 pts) the markets would close for the day.
While updated coronavirus news contributed to this plunge, rising fears of an oil war between OPEC and Russia triggered the massive futures sell-off with Brent Crude being down some 30%. To be specific, Russia and Saudi Arabia ended their peaceful negotiations regarding oil production cuts.
As analyst Graham Summers elaborated:
The U.S. shale industry requires oil to be around $60 per barrel or higher. Russia is sensing the U.S. is weak right now and has decided to attempt to bankrupt our shale industry. Saudi Arabia, which has a much lower production cost than Russia is moving to call Russia’s bluff by threatening to flood the world with oil.
All of this resulted in oil prices collapsing 30% over the weekend.
This came as a surprise to the markets, and the bears simply took over. As I have always cautioned, when investing in ETFs, you must be only exposed to those with High Volumes and deploy an exit strategy that gets you out before the masses crowd the exit doors, such as happened today.
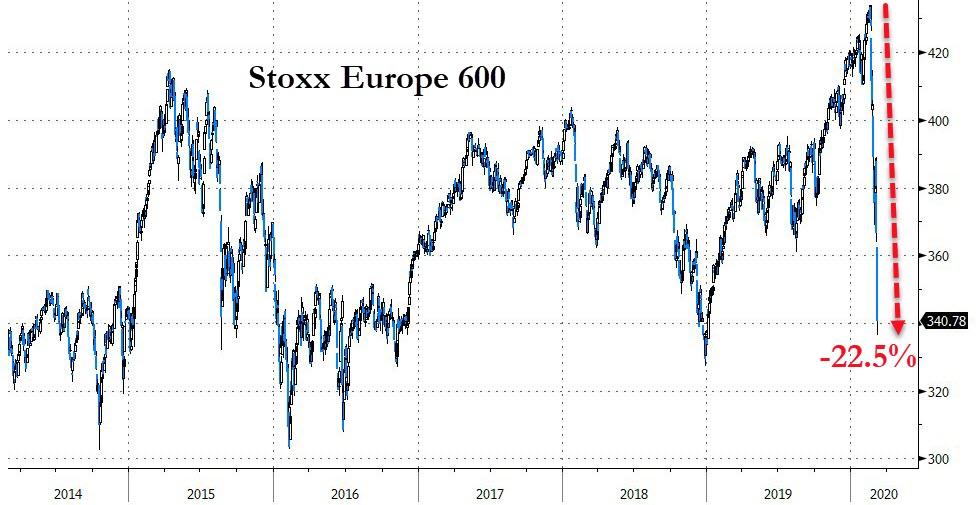
Europe stocks got even hit harder than U.S. domestic ones with the Europe Stoxx 600 now down over 22.5% from its highs just 3 weeks ago. This is what happens when bubbles burst, while it clearly confirms that Central Bankers are not omnipotent.
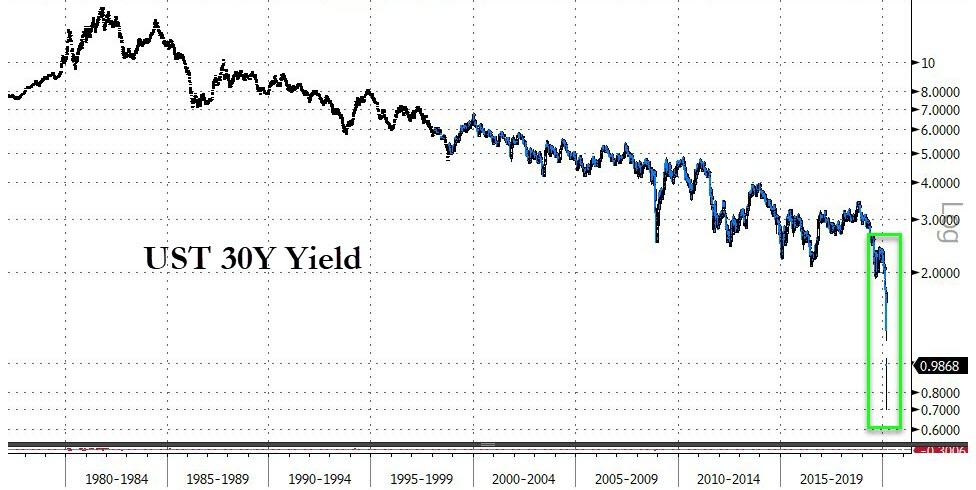
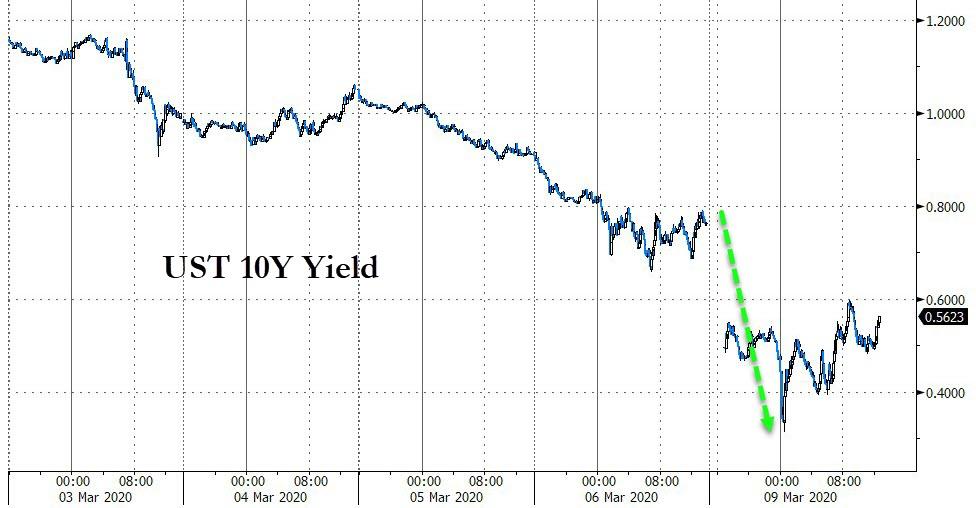
Bond yields got crushed again with the 30-year tumbling to under 1%, while the widely followed 10-year lost 21 basis points to end the session at 0.559%, that is after being down to 0.313% intraday. As a result, the big banks are down 30-40% in the last 3 weeks. Ouch!
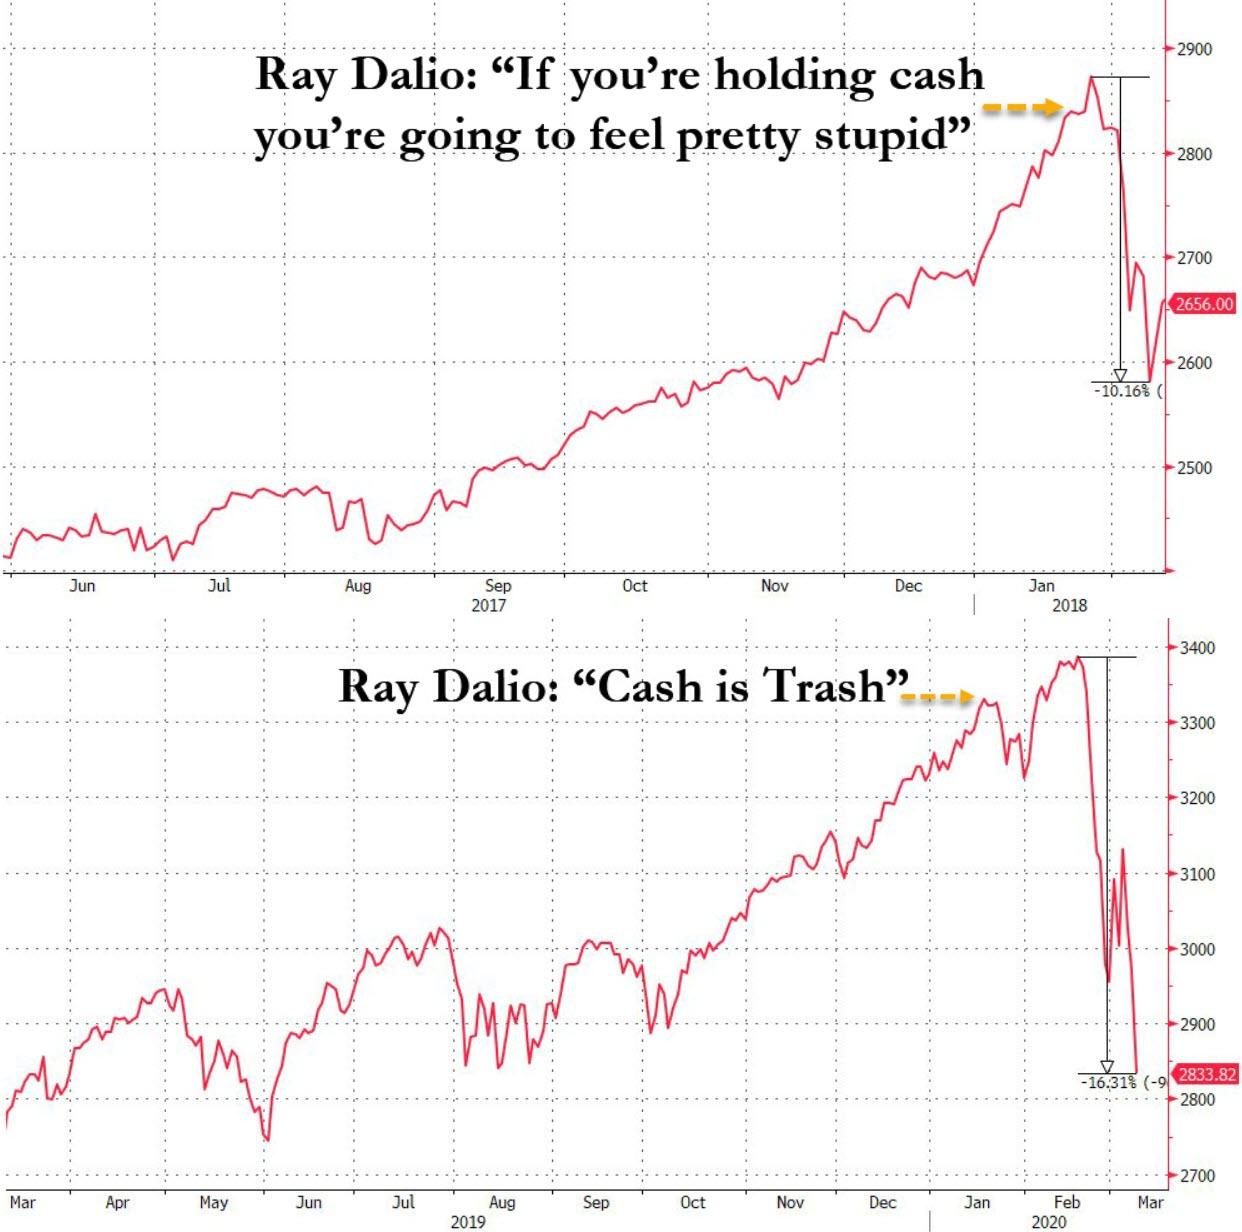
Even the big boys, like hedge fund guru Ray Dalio, got caught uttering the wrong words at the wrong time, as this chart by Bloomberg shows.
It’s good to be watching this debacle unfold from the safety of the sidelines.
2. ETFs in the Spotlight
In case you missed the announcement and description of this section, you can again.
It features 10 broadly diversified and sector ETFs from my HighVolume list as posted every Saturday. Furthermore, they are screened for the lowest MaxDD% number meaning they have been showing better resistance to temporary sell offs than all others over the past year.
The below table simply demonstrates the magnitude with which some of the ETFs are fluctuating regarding their positions above or below their respective individual trend lines (%+/-M/A). A break below, represented by a negative number, shows weakness, while a break above, represented by a positive percentage, shows strength.
For hundreds of ETF choices, be sure to reference Thursday’s StatSheet.
For this past domestic “Buy” cycle, which ended on 2/27/2020, here’s how some our candidates have fared:
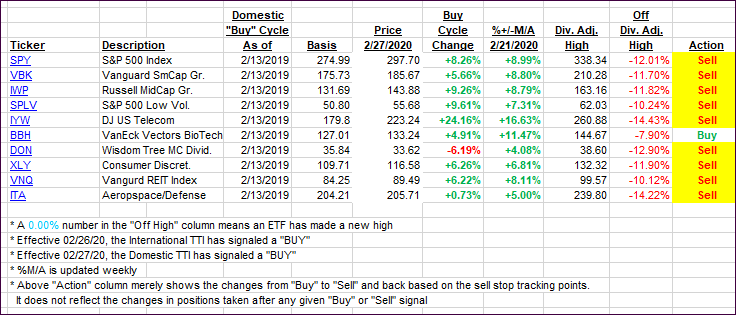
Click image to enlarge
Again, the %+/-M/A column above shows the position of the various ETFs in relation to their respective long-term trend lines, while the trailing sell stops are being tracked in the “Off High” column. The “Action” column will signal a “Sell” once the -8% point has been taken out in the “Off High” column. For more volatile sector ETFs, the trigger point is -10%.
3. Trend Tracking Indexes (TTIs)
Our TTIs plunged and are now positioned deeply in bear market territory.
Here’s how we closed 03/09/2020:
Domestic TTI: -14.53% below its M/A (prior close -6.42%)—Sell signal effective 02/27/2020
International TTI: -14.09% below its M/A (prior close -7.05%)—Sell signal effective 02/26/2020
Disclosure: I am obliged to inform you that I, as well as my advisory clients, own some of the ETFs listed in the above table. Furthermore, they do not represent a specific investment recommendation for you, they merely show which ETFs from the universe I track are falling within the specified guidelines.
Contact Ulli