
- Moving the markets
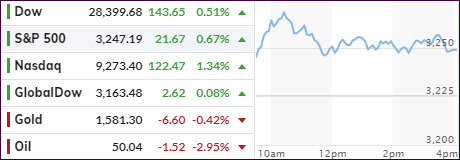
After Friday’s drubbing, and in view of China’s stock market getting clobbered at the tune of some -8%, domestic equities jumped right after the opening bell. While the latter part of the session was flat, the major indexes made up some lost ground in part thanks to optimism that the coronavirus will be contained.
Helping the recovery were encouraging data from the manufacturing sector, whose PMI index rose to a six-month high of 50.9% in January against expectations of 48.5%. That is significant in that any reading below 50% indicates contraction while any reading above it shows expansion.
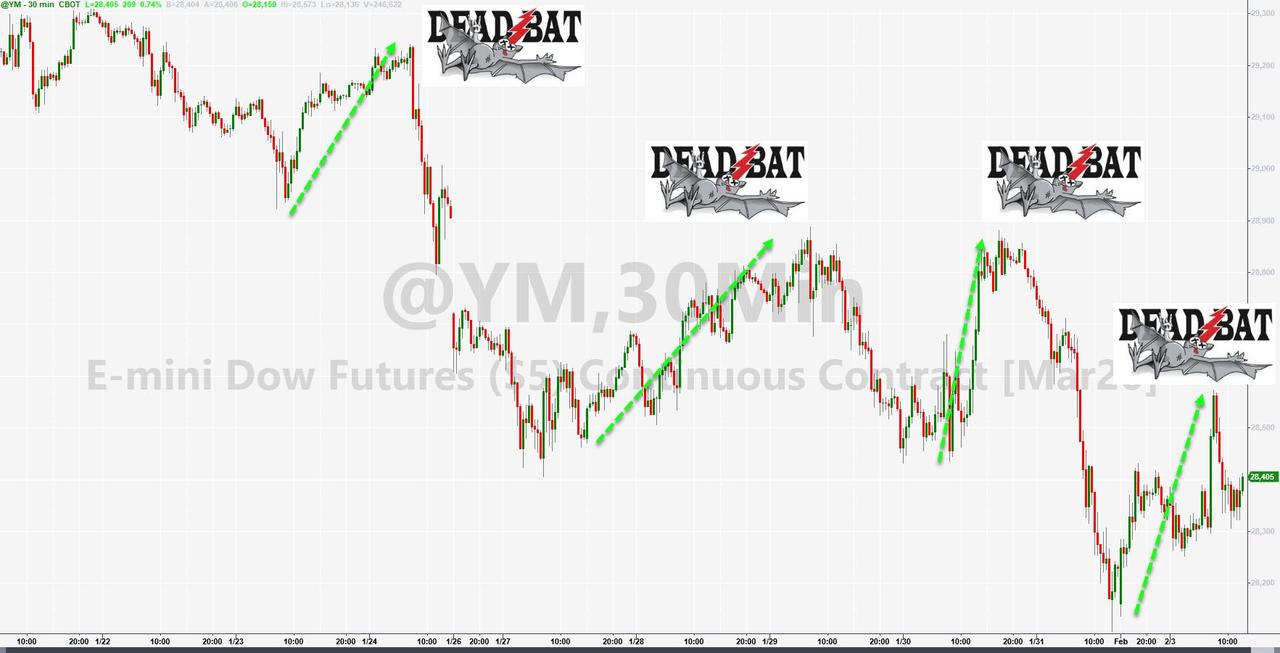
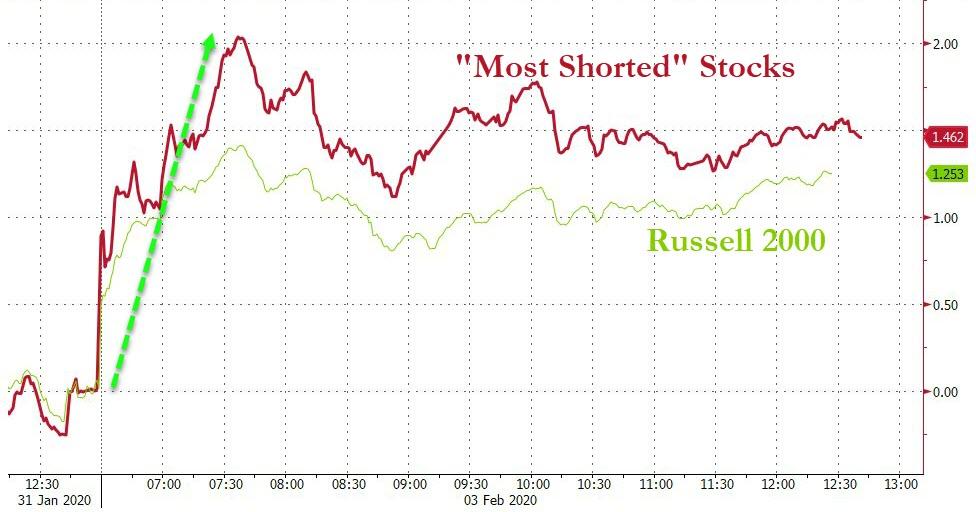
Nevertheless, the entire rebound was about nothing, causing ZH to describe today’s action as simply another “dead-bat-bounce,” as this chart demonstrates. However, an early short squeeze helped to get the bullish momentum going.
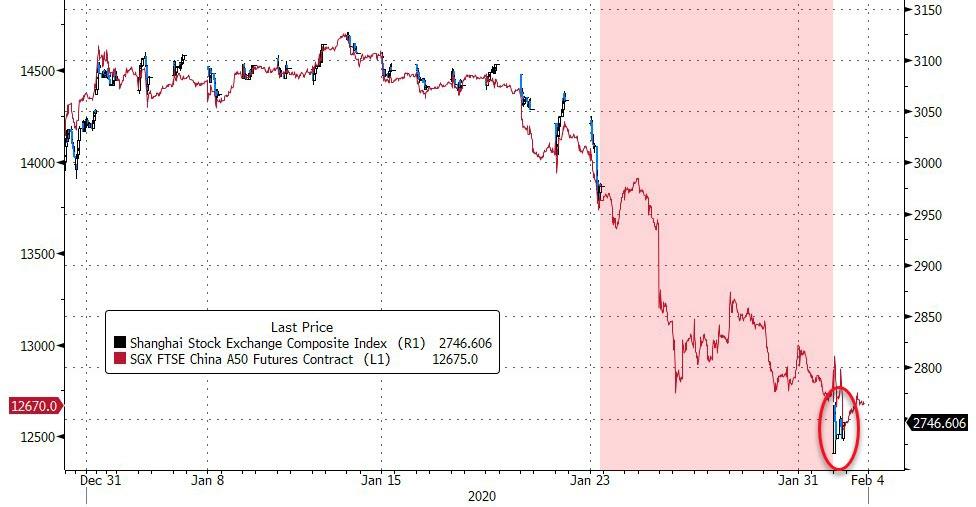
Concerns continue to linger about the Chinese stock market, which not only dropped precipitously but did so despite a ban on short selling. Trading was halted for hundreds of companies, after their prices dropped 10%, which triggered the mandatory hold. It appears that there is more fallout to come.
All that upheaval happened despite the POBC (Peoples Bank of China) announcing a $174 billion injection into their economic system to stem the downturn. That is to be followed by other stabilization measures.
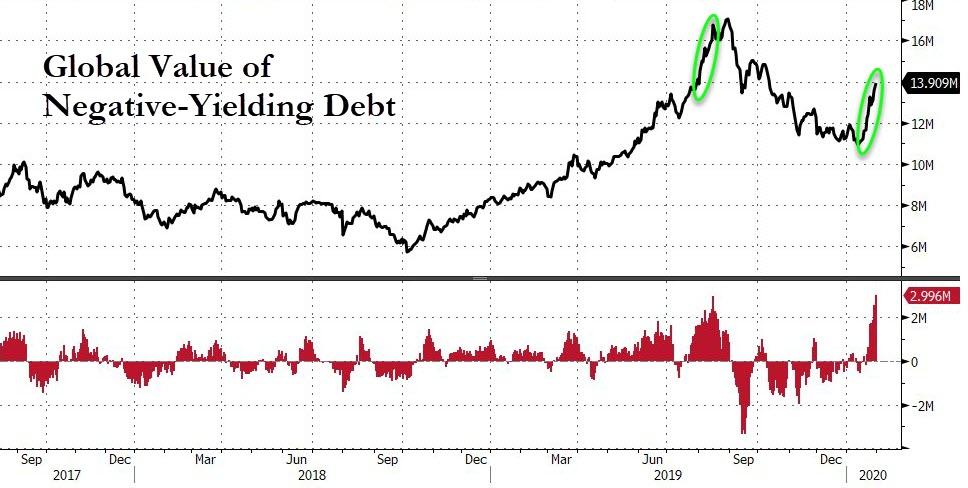
Worldwide, negative yielding debt shot up by another $3 trillion in the last 12 days, according to this chart by Bloomberg. I think it’s just a matter of time until U.S. treasuries follow that trend.
2. ETFs in the Spotlight
In case you missed the announcement and description of this section, you can again.
It features 10 broadly diversified and sector ETFs from my HighVolume list as posted every Saturday. Furthermore, they are screened for the lowest MaxDD% number meaning they have been showing better resistance to temporary sell offs than all others over the past year.
The below table simply demonstrates the magnitude with which some of the ETFs are fluctuating regarding their positions above or below their respective individual trend lines (%+/-M/A). A break below, represented by a negative number, shows weakness, while a break above, represented by a positive percentage, shows strength.
For hundreds of ETF choices, be sure to reference Thursday’s StatSheet.
For this current domestic “Buy” cycle, here’s how some our candidates have fared:
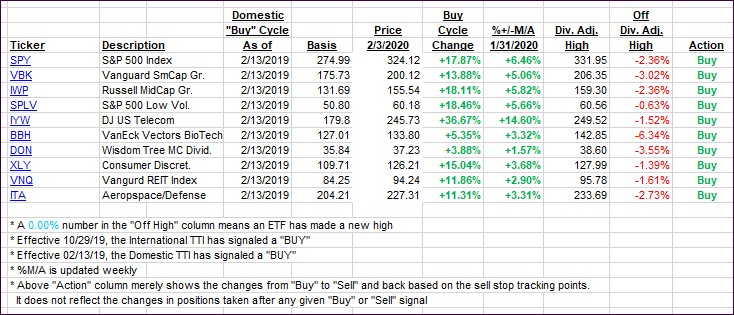
Click image to enlarge
Again, the %+/-M/A column above shows the position of the various ETFs in relation to their respective long-term trend lines, while the trailing sell stops are being tracked in the “Off High” column. The “Action” column will signal a “Sell” once the -8% point has been taken out in the “Off High” column. For more volatile sector ETFs, the trigger point is -10%.
3. Trend Tracking Indexes (TTIs)
Our Trend Tracking Indexes (TTIs) took a dive and headed closer towards their respective trend lines. Despite this pullback, the major uptrend has not been violated and all ‘Buy’ signals remain intact.
Here’s how we closed 02/03/2020:
Domestic TTI: +5.15% above its M/A (prior close +4.45%)—Buy signal effective 02/13/2019
International TTI: +2.61% above its M/A (prior close +2.55%)—Buy signal effective 10/29/2019
Disclosure: I am obliged to inform you that I, as well as my advisory clients, own some of the ETFs listed in the above table. Furthermore, they do not represent a specific investment recommendation for you, they merely show which ETFs from the universe I track are falling within the specified guidelines.
Contact Ulli