
- Moving the markets
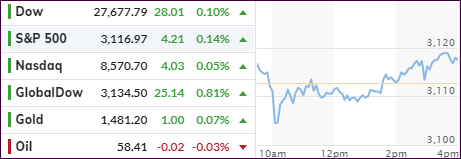
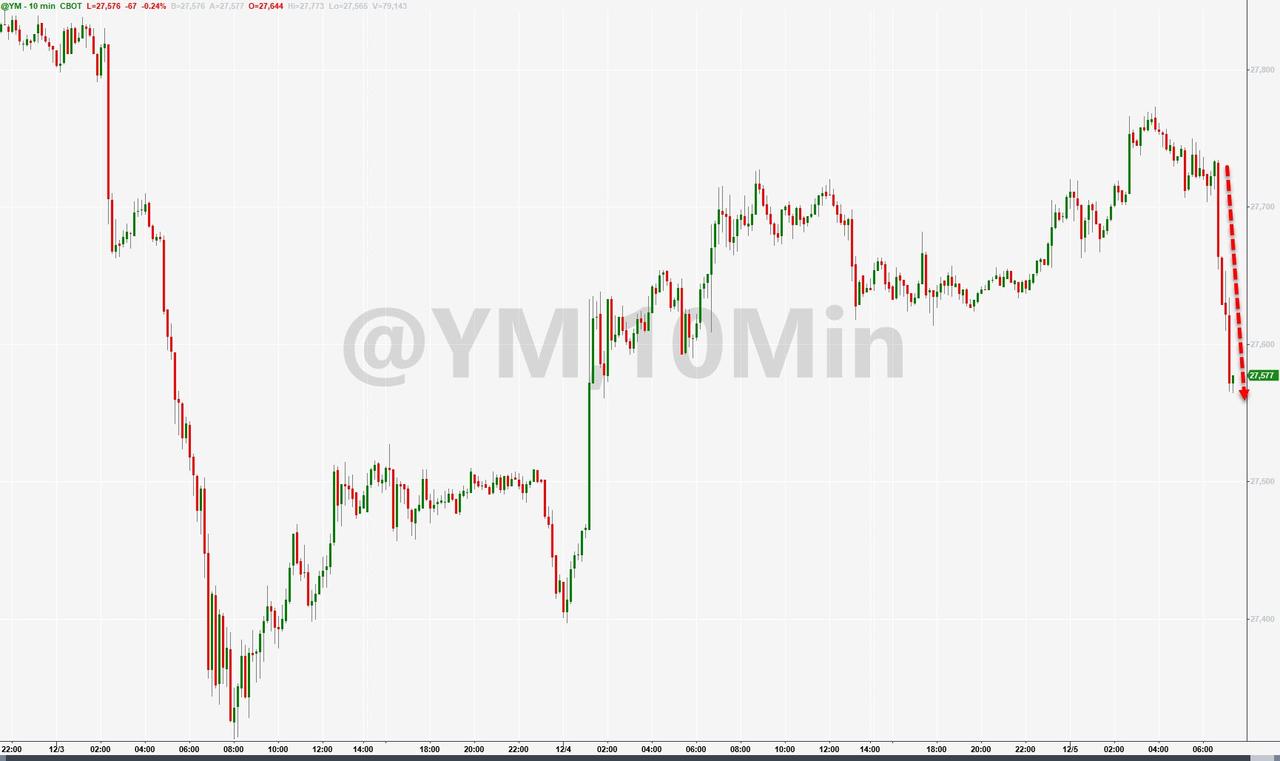
An early morning pop gave way to a drop, which gave way to a slow but steady recovery with the major indexes managing to reclaim their respective unchanged lines by a small margin.
What caused the comeback? Nothing noteworthy, other than a China trade spokesperson uttering the words that computer algos thrive on, namely that the so-called phase 1 negotiations designed to cease tariff hostilities, are “progressing.”
But the spokesman emphasized China’s desire to make existing tariff rollbacks a part of any resolution, which may not sit well with the White House. As a result, the tug-of-war to save face is bound to continue.
On deck tomorrow will be the always eagerly anticipated jobs report with the consensus forecast calling for a gain of 180k new jobs. Anything close to that number will likely give the markets a boost, unless bad trade news provides the bears with something to cheer about.
2. ETFs in the Spotlight
In case you missed the announcement and description of this section, you can read it here again.
It features 10 broadly diversified and sector ETFs from my HighVolume list as posted every Saturday. Furthermore, they are screened for the lowest MaxDD% number meaning they have been showing better resistance to temporary sell offs than all others over the past year.
The below table simply demonstrates the magnitude with which some of the ETFs are fluctuating regarding their positions above or below their respective individual trend lines (%+/-M/A). A break below, represented by a negative number, shows weakness, while a break above, represented by a positive percentage, shows strength.
For hundreds of ETF choices, be sure to reference Thursday’s StatSheet.
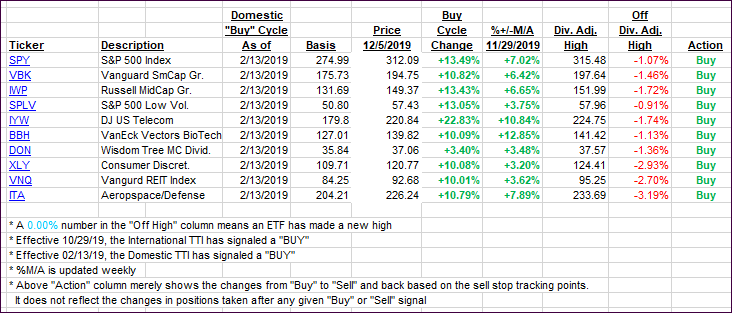
For this current domestic “Buy” cycle, here’s how some our candidates have fared:
Click image to enlarge
Again, the %+/-M/A column above shows the position of the various ETFs in relation to their respective long-term trend lines, while the trailing sell stops are being tracked in the “Off High” column. The “Action” column will signal a “Sell” once the -8% point has been taken out in the “Off High” column. For more volatile sector ETFs, the trigger point is -10%.
3. Trend Tracking Indexes (TTIs)
Our Trend Tracking Indexes (TTIs) meandered higher, as the markets dug themselves out of a hole.
Here’s how we closed 12/5/2019:
Domestic TTI: +5.35% above its M/A (prior close +5.17%)—Buy signal effective 02/13/2019
International TTI: +3.17% above its M/A (prior close +2.97%)—Buy signal effective 10/29/2019
Disclosure: I am obliged to inform you that I, as well as my advisory clients, own some of the ETFs listed in the above table. Furthermore, they do not represent a specific investment recommendation for you, they merely show which ETFs from the universe I track are falling within the specified guidelines.
Contact Ulli