
- Moving the markets
I mentioned last Friday that we would need a good trade headline to give stocks a boost. That is exactly what happened but not the way you think.
There was no news in US-China trade arena, so the Trump administration came out and played down or disputed reports that they were considering blocking Chinese companies from listing shares on US stock exchanges.
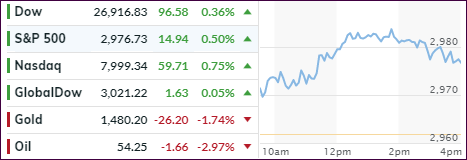
The net effect was that Friday’s dump after that announcement was reversed and equities pumped on this last day of September and maintained their positions above the unchanged line all the way into the close.
For the month, the major indexes ended up barely in the green, but the S&P 500 gained +1.74%, while for the quarter, all indexes were higher with SmallCaps having an ugly close. Still, my favorite low volatility ETF (SPLV) managed to come out ahead by posting a solid +2.06%.
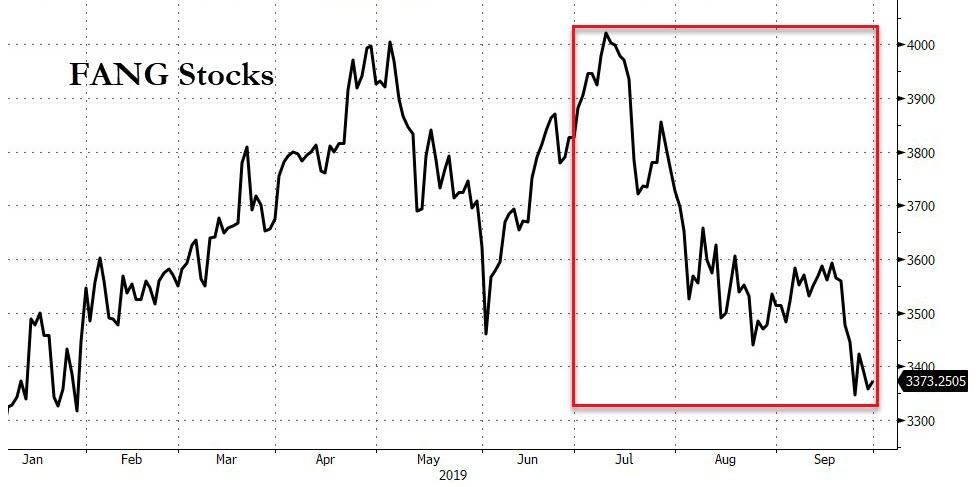
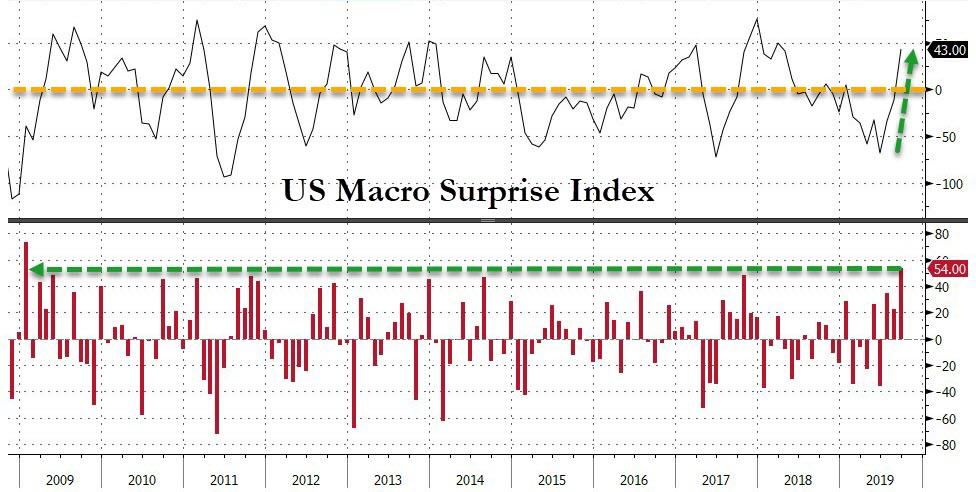
Not doing so well were the FANG stocks, which fell for the third straight month in September and had their worst quarterly drop since Q4 2018. ZH noted that we heard some economically encouraging news in that September saw one of the biggest surges in economic surprise data since January 2009.
Still, we’re now looking straight in the jaws of October, which historically has been a month where anything is possible.
2. ETFs in the Spotlight
In case you missed the announcement and description of this section, you can read it here again.
It features 10 broadly diversified and sector ETFs from my HighVolume list as posted every Saturday. Furthermore, they are screened for the lowest MaxDD% number meaning they have been showing better resistance to temporary sell offs than all others over the past year.
The below table simply demonstrates the magnitude with which some of the ETFs are fluctuating regarding their positions above or below their respective individual trend lines (%+/-M/A). A break below, represented by a negative number, shows weakness, while a break above, represented by a positive percentage, shows strength.
For hundreds of ETF choices, be sure to reference Thursday’s StatSheet.
For this current domestic “Buy” cycle, here’s how some our candidates have fared:
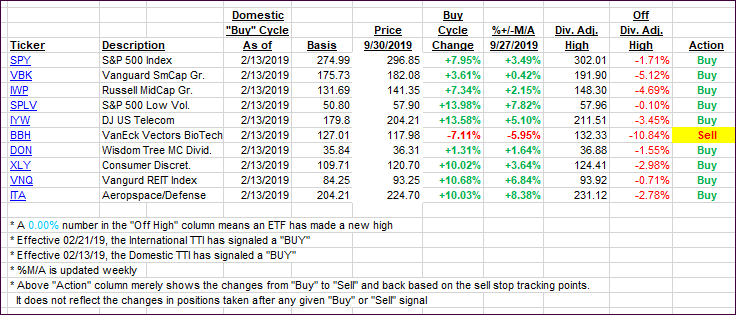
Again, the %+/-M/A column above shows the position of the various ETFs in relation to their respective long-term trend lines, while the trailing sell stops are being tracked in the “Off High” column. The “Action” column will signal a “Sell” once the -8% point has been taken out in the “Off High” column. For more volatile sector ETFs, the trigger point is -10%.
3. Trend Tracking Indexes (TTIs)
Our Trend Tracking Indexes (TTIs) edged a little higher as we saw a modest rally into the end of September.
Here’s how we closed 09/30/2019:
Domestic TTI: +3.98% above its M/A (prior close +3.49%)—Buy signal effective 02/13/2019
International TTI: +0.73% above its M/A (prior close +1.18%)—Buy signal effective 09/12/2019
Disclosure: I am obliged to inform you that I, as well as my advisory clients, own some of the ETFs listed in the above table. Furthermore, they do not represent a specific investment recommendation for you, they merely show which ETFs from the universe I track are falling within the specified guidelines.
Contact Ulli