
ETF Tracker StatSheet
You can view the latest version here.
STOCKS STRUGGLE TO FIND SUPPORT
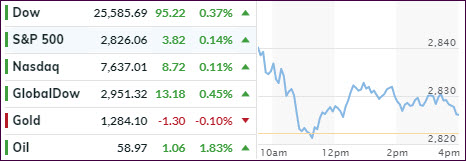
[Chart courtesy of MarketWatch.com]
- Moving the markets
The entire week has been a roller coaster ride, as stocks tried to find some support but ended up on the downside with the Dow now extending its losing streak to five straight weeks, its worst one since June 2011.
An early morning rally stoked bullish sentiment following reports that Trump was considering easing up on restrictions against Huawei Technologies as “some part” of a larger deal with China.
That helped, even though tensions between the two countries have increased and a move away from an amicable trade deal seemed a foregone conclusion, as Trump again confirmed the Chinese company to be “very dangerous” from a security perspective.
Despite the major indexes closing in the green, and the session featuring a pump, dump and recovery theme, the S&P 500 lost -1.2% for the week. It looks to me that markets will continue to be overly sensitive and reactive to any trade news, and it appears that we are at times taking one step forward to be followed by two steps back.
While
the focus is and likely will remain on the U.S.-China trade war dispute,
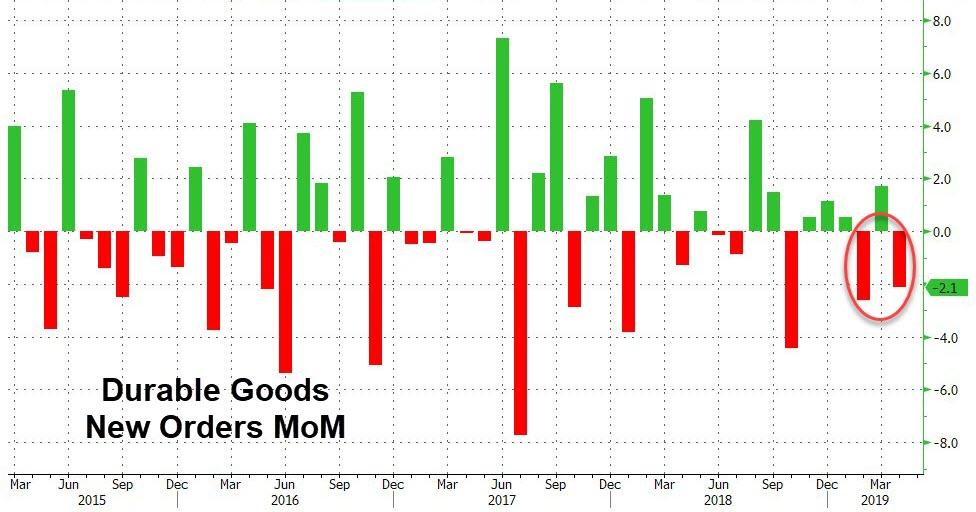
the real elephant in the room is global growth, which will only improve once
global and U.S. economic data show signs of steadiness. Today’s tumble in durable
goods was not a start in the right direction.
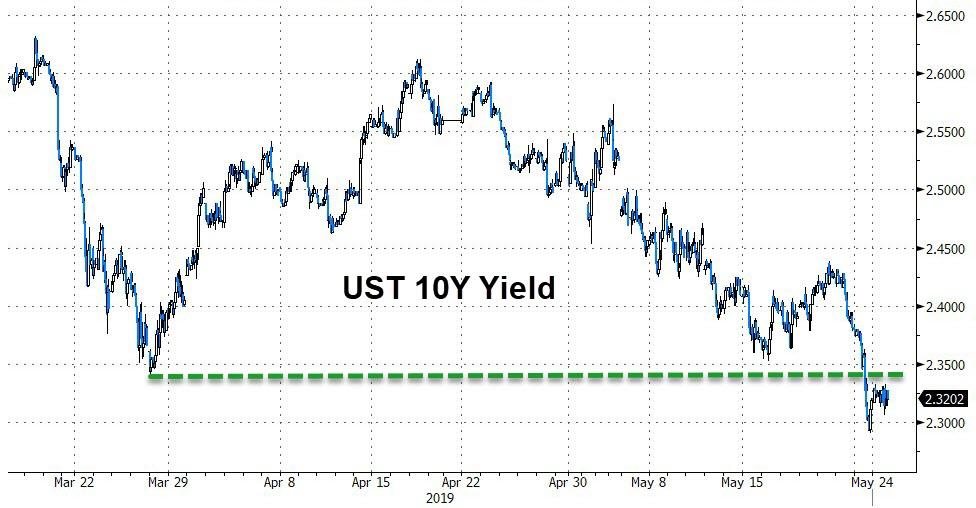
You can easily see that things are not going the right way economically by observing the bond market. The yield on the 10-year tumbled and has done so for the past five weeks out of six. Today it closed at 2.32%, its lowest since October 2017. If the economy was rip-roaring, we would have rising rates and not falling ones.
As ZH pointed out, the Fed now has a problem:
How’s it going to be able to support the market (with lower rates) when investors are already pricing in 45 bps (0.45%) of rate cuts for 2019?
It appears that the market thinks the recession has already started.
Right now, our Trend Tracking Indexes (TTIs) still support the bullish theme; but only by a small margin. It would not surprise me to see that change soon, as our International TTI, which usually functions as the proverbial canary in the coalmine, is already motioning that a ‘Sell’ signal may be forthcoming.
2. ETFs in the Spotlight
In case you missed the announcement and description of this section, you can read it here again.
It features 10 broadly diversified and sector ETFs from my HighVolume list as posted every Saturday. Furthermore, they are screened for the lowest MaxDD% number meaning they have been showing better resistance to temporary sell offs than all others over the past year.
The below table simply demonstrates the magnitude with which some of the ETFs are fluctuating regarding their positions above or below their respective individual trend lines (%+/-M/A). A break below, represented by a negative number, shows weakness, while a break above, represented by a positive percentage, shows strength.
For hundreds of ETF choices, be sure to reference Thursday’s StatSheet.
For this current domestic “Buy” cycle, here’s how some our candidates have fared:
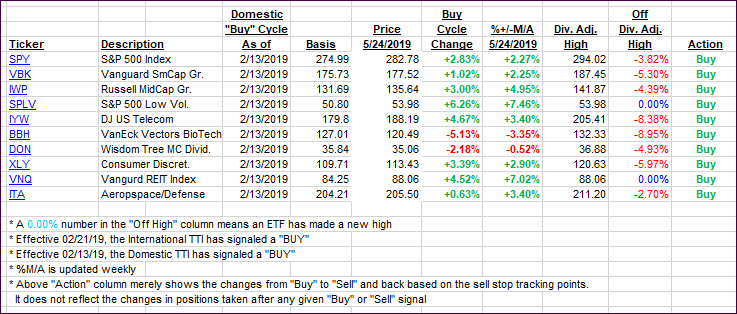
Again, the %+/-M/A column above shows the position of the various ETFs in relation to their respective long-term trend lines, while the trailing sell stops are being tracked in the “Off High” column. The “Action” column will signal a “Sell” once the -8% point has been taken out in the “Off High” column. For more volatile sector ETFs, the trigger point is -10%.
3. Trend Tracking Indexes (TTIs)
Our Trend Tracking Indexes (TTIs) both improved, but the International one remains slightly below its trend line. I will give more time to better be able to evaluate whether this break below has legs and warrants a ‘Sell’ signal.
Here’s how we closed 05/24/2019:
Domestic TTI: +2.02% above its M/A (last close +1.80%)—Buy signal effective 02/13/2019
International TTI: -0.42% below its M/A (last close -0.97%)—Buy signal effective 02/21/2019
Disclosure: I am obliged to inform you that I, as well as my advisory clients, own some of the ETFs listed in the above table. Furthermore, they do not represent a specific investment recommendation for you, they merely show which ETFs from the universe I track are falling within the specified guidelines.
———————————————————-
WOULD YOU LIKE TO HAVE YOUR INVESTMENTS PROFESSIONALLY MANAGED?
Do you have the time to follow our investment plans yourself? If you are a busy professional who would like to have his portfolio managed using our methodology, please contact me directly or get more details here.
———————————————————
Back issues of the ETF Tracker are available on the web.
Contact Ulli