
ETF Tracker StatSheet
Q1 GDP Blows Through Expectations
- Moving the markets
The Q1 GDP number blew through expectations by soaring 3.2% annualized, which was some 50% higher than the 2.3% forecast. However, when looking under the hood, analysts realized that one-time items such as a surge in inventories and a smaller trade deficit are simply not sustainable making this number suspect as far as future advances is concerned.
The core drivers, namely consumption and fixed investment were weak and dropped from Q4. According to ZH, the internal numbers showed that this was the weakest quarter for household spending in five years. Tweeted econ guru David Rosenberg:
This was a low-quality GDP report. All one-offs – lower imports, higher inventories & Pentagon spending. Real final private sales a puny 1.3%. Removing more lipstick from this pig shows cyclically-adjusted GDP contracting at a 2% annual rate; deepest decline in nearly a decade.
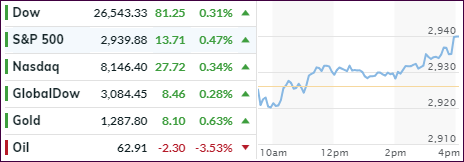
Maybe that’s why market reaction was almost muted with stocks pulling back early on. Not helping the lurking bulls was a big miss in earnings and production by Exxon, which tumbled 3% and weighed heavily on the Dow. Intel followed suit and its stock price was punished -10%, as its outlook fell way below estimates contributing to the Nasdaq’s early decline.
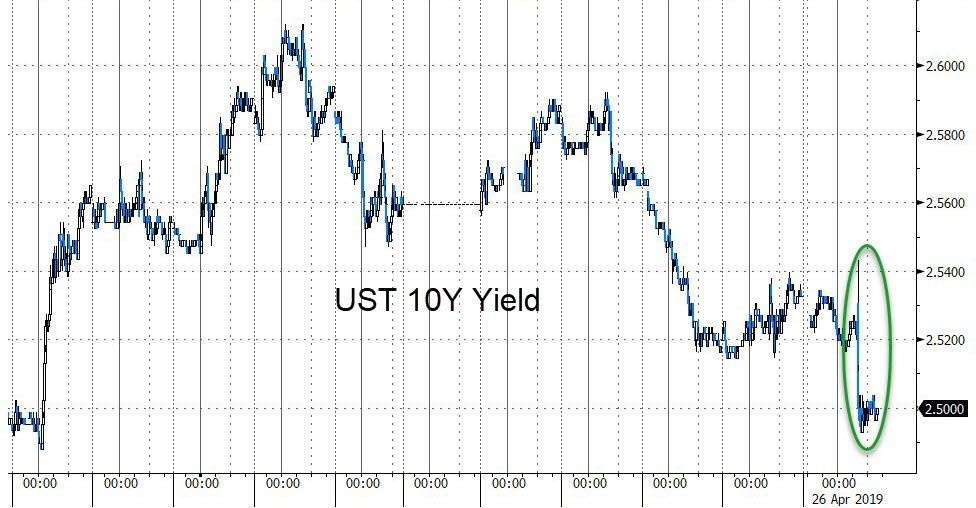
Seeing a strong GDP number, you would have expected bond yields to rise, but no, the exact opposite occurred with the 10-year dropping 3.3 basis points. It seems that dovishness prevailed, despite the stronger than expected GDP number, which I think is a clear sign that Wall Street traders consider this to be an economy in contraction and not one in expansion mode.
Be that as it may, at the end of this week, two of major three indexes closed in the green with the S&P 500 and Nasdaq notching record closes, while the Dow had its first down week in 5. On the other side of the globe, Chinese equities puked and had their worst week in 6 months.
Looking at the big picture, I noticed that this chart has changed in that global money supply, one of the main drivers of the current rally, has tumbled? Does that mean the current rebound is about to end?
- ETFs in the Spotlight
In case you missed the announcement and description of this section, you can read it here again.
It features 10 broadly diversified and sector ETFs from my HighVolume list as posted every Saturday. Furthermore, they are screened for the lowest MaxDD% number meaning they have been showing better resistance to temporary sell offs than all others over the past year.
The below table simply demonstrates the magnitude with which some of the ETFs are fluctuating regarding their positions above or below their respective individual trend lines (%+/-M/A). A break below, represented by a negative number, shows weakness, while a break above, represented by a positive percentage, shows strength.
For hundreds of ETF choices, be sure to reference Thursday’s StatSheet.
For this current domestic “Buy” cycle, here’s how some our candidates have fared:
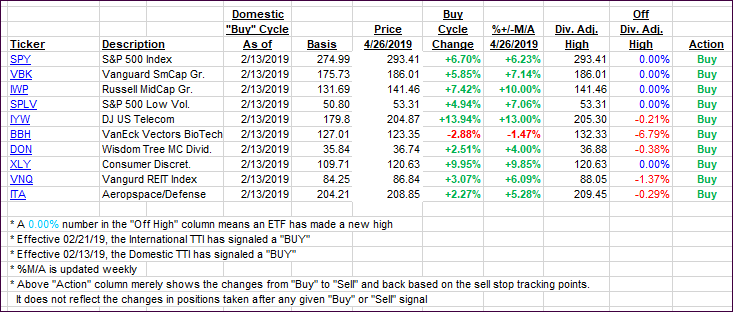
Again, the %+/-M/A column above shows the position of the various ETFs in relation to their respective long-term trend lines, while the trailing sell stops are being tracked in the “Off High” column. The “Action” column will signal a “Sell” once the -8% point has been taken out in the “Off High” column. For more volatile sector ETFs, the trigger point is -10%.
- Trend Tracking Indexes (TTIs)
Our Trend Tracking Indexes (TTIs) bounced, as the week ended on a bullish note.
Here’s how we closed 04/26/2019:
Domestic TTI: +6.45% above its M/A (last close +5.93%)—Buy signal effective 02/13/2019
International TTI: +3.89% above its M/A (last close +3.56%)—Buy signal effective 02/21/2019
Disclosure: I am obliged to inform you that I, as well as my advisory clients, own some of the ETFs listed in the above table. Furthermore, they do not represent a specific investment recommendation for you, they merely show which ETFs from the universe I track are falling within the specified guidelines.
———————————————————-
WOULD YOU LIKE TO HAVE YOUR INVESTMENTS PROFESSIONALLY MANAGED?
Do you have the time to follow our investment plans yourself? If you are a busy professional who would like to have his portfolio managed using our methodology, please contact me directly or get more details at:
https://theetfbully.com/personal-investment-management/
———————————————————
Back issues of the ETF/No Load Fund Tracker are available on the web at:
https://theetfbully.com/newsletter-archives/
Contact Ulli