
- Moving the markets
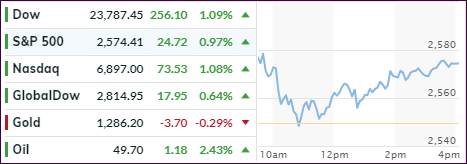
The major indexes managed to string together a 3-day winning streak thanks to continued optimism over the status of US-China trade talks. In a show of good faith, the warring parties extended their discussions until Wednesday. Word has it that gradual progress is being made, however, a true and final deal appears to be not on the horizon.
But markets prefer to react to hope and wishful thinking so, after some early see-sawing, the major indexes managed to gain about 1 percent.
On the economic front, headlines were mixed, as the Labor market unexpected hit an air pocket with job openings, hires and quits all tumbling. This confirms that, along with many other data points of the recent past, the economy is slowing which, in my view, was one of the reasons Fed head Powell did a sudden U-turn last week and adopted a softer (dovish) stance towards interest rates.
Europe wasn’t any better regarding econ data, as powerhouse Germany saw its industrial production collapse; a good thing only when considering that the ECB won’t tighten as aggressively and may very well do their best imitation of Jerome Powell. No tightening equals higher stock prices in the bizarre world we are living in.
ZH posted the question “who will be right?” in this chart showing the divergence between interest rates and the S&P 500. Will bond yields rise or equities sink to get back in sync?
I am sure we’ll find out soon enough.
- ETFs in the Spotlight
In case you missed the announcement and description of this section, you can read it here again.
It features 10 broadly diversified and sector ETFs from my HighVolume list as posted every Saturday. Furthermore, they are screened for the lowest MaxDD% number meaning they have been showing better resistance to temporary sell offs than all others over the past year.
The below table simply demonstrates the magnitude with which some of the ETFs are fluctuating regarding their positions above or below their respective individual trend lines (%M/A). A break below, represented by a negative number, shows weakness, while a break above, represented by a positive percentage, shows strength.
For hundreds of ETF choices, be sure to reference Thursday’s StatSheet.
Year to date, here’s how our original candidates from the last cycle have fared:
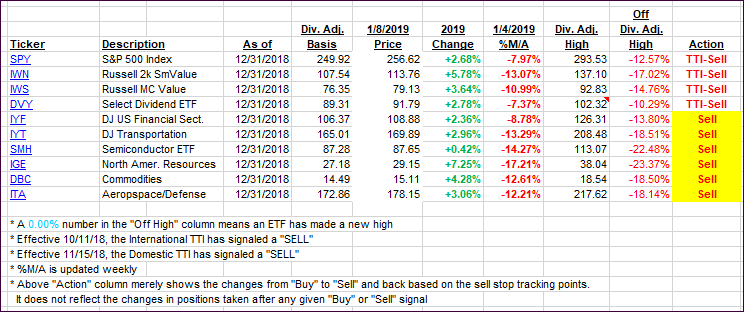
Again, the %M/A column above shows the position of the various ETFs in relation to their respective long-term trend lines, while the trailing sell stops are being tracked in the “Off High” column. The “Action” column will signal a “Sell” once the -8% point has been taken out in the “Off High” column. For more volatile sector ETFs, the trigger point is -10%.
- Trend Tracking Indexes (TTIs)
Our Trend Tracking Indexes (TTIs) improved again but remain solidly below their respective trend lines.
Here’s how we closed 01/08/2019:
Domestic TTI: -6.13% below its M/A (last close -7.13%)—Sell signal effective 11/15/2018
International TTI: -5.96% below its M/A (last close -6.56%)—Sell signal effective 10/11/2018
Disclosure: I am obliged to inform you that I, as well as my advisory clients, own some of the ETFs listed in the above table. Furthermore, they do not represent a specific investmenrecommendation for you, they merely show which ETFs from the universe I track are falling.
Contact Ulli