
- Moving the markets
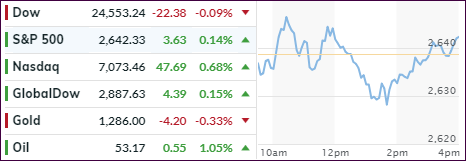
It was another volatile and directionless day with the indexes rallying and selling off depending on negative or positive headlines. We closed mixed with the Dow dropping a tad and the S&P 500 gaining a fraction. The Nasdaq fared better by adding +0.68%, although that may reverse tomorrow, as Intel just announced a revenue miss causing its stock to plunge 7% in after-hours trading.
The trade battle with China remained mired in uncertainty, especially after Wilbur Ross came out swinging by announcing that “U.S. and China are miles and miles away from a trade resolution” but acknowledged that a large China delegation will arrive next week to talk trade. You can be sure that hype and hope will be our constant companions.
Interest rates dropped with the 10-year bond settling at 2.712%, down 3 basis points from yesterday. Make no mistake, the direction of bond yields will determine the direction of the stock market, which always benefits from lower rates. The S&P 500 is in perfect sync with yield expectations, as this chart clearly shows. That’s why I watch interest rates closely, since they tend to forecast the path of equities in general.
- ETFs in the Spotlight
In case you missed the announcement and description of this section, you can read it here again.
It features 10 broadly diversified and sector ETFs from my HighVolume list as posted every Saturday. Furthermore, they are screened for the lowest MaxDD% number meaning they have been showing better resistance to temporary sell offs than all others over the past year.
The below table simply demonstrates the magnitude with which some of the ETFs are fluctuating regarding their positions above or below their respective individual trend lines (%M/A). A break below, represented by a negative number, shows weakness, while a break above, represented by a positive percentage, shows strength.
For hundreds of ETF choices, be sure to reference Thursday’s StatSheet.
Year to date, here’s how our original candidates from the last cycle have fared:
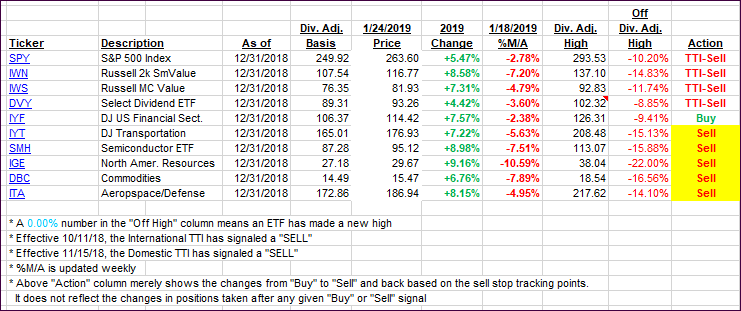
Again, the %M/A column above shows the position of the various ETFs in relation to their respective long-term trend lines, while the trailing sell stops are being tracked in the “Off High” column. The “Action” column will signal a “Sell” once the -8% point has been taken out in the “Off High” column. For more volatile sector ETFs, the trigger point is -10%.
- Trend Tracking Indexes (TTIs)
Our Trend Tracking Indexes (TTIs) moved immaterially.
Here’s how we closed 01/24/2019:
Domestic TTI: -2.90% below its M/A (last close -3.34%)—Sell signal effective 11/15/2018
International TTI: -3.20% below its M/A (last close -3.32%)—Sell signal effective 10/11/2018
Disclosure: I am obliged to inform you that I, as well as my advisory clients, own some of the ETFs listed in the above table. Furthermore, they do not represent a specific investment recommendation for you, they merely show which ETFs from the universe I track are falling.
Contact Ulli