
- Moving the markets
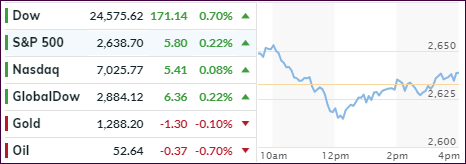
For a while it seemed that ‘bad news’ is ‘bad news’ again, as an early rebound reversed and sent the major indexes back into the red. After all, with the shutdown continuing, China talks going nowhere, the VIX spiking and GDP warnings of zero percent, the way of least resistance was down.
However, the bulls were not ready to fold, and a slow and steady climb pushed the major indexes back into the green, as some solid earnings from IBM and Proctor & Gamble pulled enough buyers in to propel the markets out of the mid-day doldrums.
It was a roller-coaster ride nonetheless with bulls and bear perfecting the game of musical chairs with the European markets following suit by pumping and dumping. In part, this uncertainty was rooted in broader concerns not only about global growth but China’s growth prospects, or rather the lack thereof.
The trade talks got elevated to battle stage with China warning that U.S markets would crash, if Trump would not agree to a deal. Not to be outdone by the verbal boxing match, he responded by threatening to unleash more tariffs, if the Chines do not agree with his ideas.
So, the tit-for-tat continues and depending on the level of hype for any given day, and how the computer algos interpret it, we may see a rally or a decline.
In the meantime, earnings expectations continue to slide, while the source of the 2019 rebound, namely central bank balance sheet expansion, has stalled once again. Hat tip goes to ZH for these 2 charts.
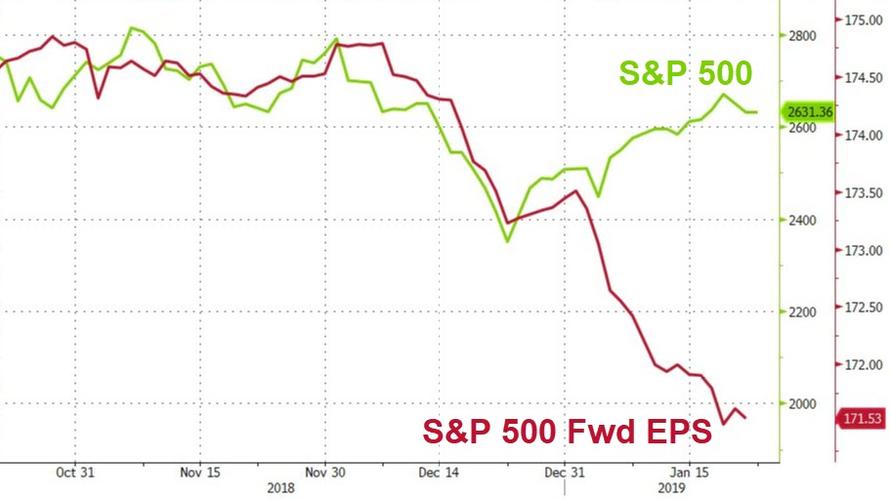
- ETFs in the Spotlight
In case you missed the announcement and description of this section, you can read it here again.
It features 10 broadly diversified and sector ETFs from my HighVolume list as posted every Saturday. Furthermore, they are screened for the lowest MaxDD% number meaning they have been showing better resistance to temporary sell offs than all others over the past year.
The below table simply demonstrates the magnitude with which some of the ETFs are fluctuating regarding their positions above or below their respective individual trend lines (%M/A). A break below, represented by a negative number, shows weakness, while a break above, represented by a positive percentage, shows strength.
For hundreds of ETF choices, be sure to reference Thursday’s StatSheet.
Year to date, here’s how our original candidates from the last cycle have fared:
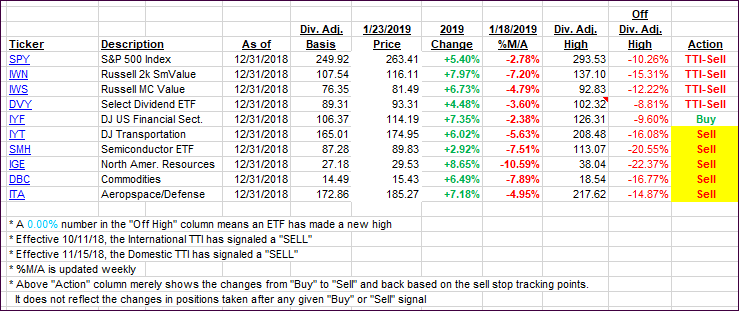
Again, the %M/A column above shows the position of the various ETFs in relation to their respective long-term trend lines, while the trailing sell stops are being tracked in the “Off High” column. The “Action” column will signal a “Sell” once the -8% point has been taken out in the “Off High” column. For more volatile sector ETFs, the trigger point is -10%.
- Trend Tracking Indexes (TTIs)
Our Trend Tracking Indexes (TTIs) changed only by a small margin.
Here’s how we closed 01/23/2019:
Domestic TTI: -3.34% below its M/A (last close -3.27%)—Sell signal effective 11/15/2018
International TTI: -3.32% below its M/A (last close -3.55%)—Sell signal effective 10/11/2018
Disclosure: I am obliged to inform you that I, as well as my advisory clients, own some of the ETFs listed in the above table. Furthermore, they do not represent a specific investment recommendation for you, they merely show which ETFs from the universe I track are falling.
Contact Ulli