
ETF Tracker StatSheet
COMPUTER ALGOS SHIFT INTO OVERDRIVE
- Moving the markets
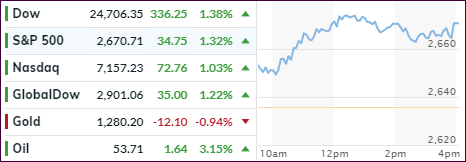
Yesterday’s trade rumor caused the algos to shift into overdrive today after Bloomberg reported that Chinese officials were open to eliminating an imbalance with the U.S., which has been a major hurdle to trade negotiations since last year.
The follow up story was that China offered to go on a “six-year buying spree to ramp up imports from the U.S.,” which would greatly sooth the existing rocky relationship. China would increase purchases of U.S. imports over six years to reach more than $1 trillion per year and would also attempt to reduce its trade surplus ($323 billion) to zero by 2024.
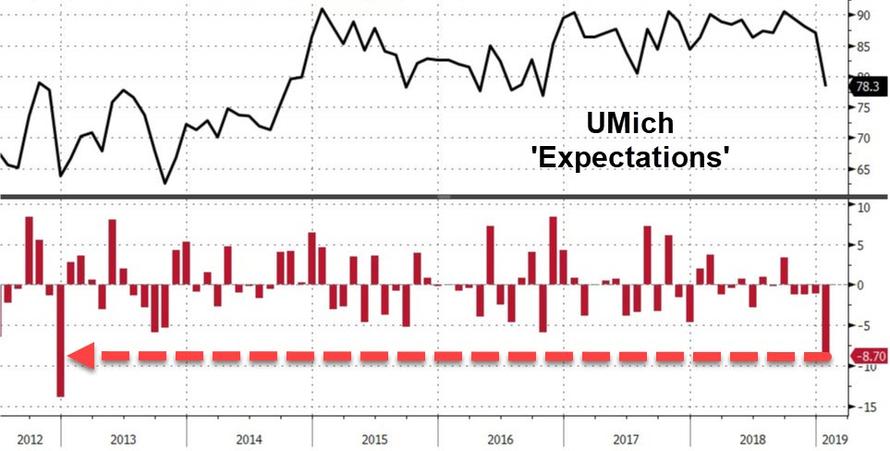
The market took this as a confirmation that the deal was done, although it has not been confirmed, and computer algos ran with it propelling the major indexes to gains over 1% for the day. Despite the fact that consumer confidence collapsed the most to a level last seen in 2016, while ‘hope’ crashed the most since 2012, the markets barely noticed as all the attention was on the apparent “olive branch” China extended.
History shows that the stock market has not started a year this strongly since 1987, which ended with the Dow dropping -22.6% on that infamous October 19th debacle. While that does not mean that there will be a repeat performance, it means to me that sudden V-shape recoveries tend to be suspect, especially during times when computer algos and the Fed pretty much oversee market direction while underlying fundamentals no longer matter.
This article discusses the current algo rally and summarizes it as follows:
What this means, somewhat ironically, is that while everyone was blaming the algos for the December meltdown, even though nobody has “accused” the algos of creating the ongoing meltup, investors and traders know very well that the move higher is not organic, but is purely the result of systematic, algo and various other quant traders forcibly buying as a result of key technical market levels being hit.
Unfortunately for the few humans left trading stocks, this is not a buying signal, which likely means that just like in January of 2018 when retail investors finally capitulated and rushed into stocks just ahead of the February 2018 correction, so this time too it is likely that the algos will keep buying until everyone else jumps into the pool… at which point the market will once again take the elevator down.
Be that as it may, the markets have recovered most of their Q4 2018 -14% loss and are heading towards the break-even point. Our Trend Tracking Indexes (TTIs) have greatly improved and are within striking distance of an upside break of their long-term trend lines. As of today, the Domestic TTI will need to gain an additional 1.96% before a new “Buy” signal will be generated.
However, I would not be surprised to see a pullback developing next week. After all, markets don’t go up forever in a straight line, which they have so far this year, so we are way overdue for a correction.
The markets will be closed on Monday to due to the Martin Luther King holiday.
- ETFs in the Spotlight
In case you missed the announcement and description of this section, you can read it here again.
It features 10 broadly diversified and sector ETFs from my HighVolume list as posted every Saturday. Furthermore, they are screened for the lowest MaxDD% number meaning they have been showing better resistance to temporary sell offs than all others over the past year.
The below table simply demonstrates the magnitude with which some of the ETFs are fluctuating regarding their positions above or below their respective individual trend lines (%M/A). A break below, represented by a negative number, shows weakness, while a break above, represented by a positive percentage, shows strength.
For hundreds of ETF choices, be sure to reference Thursday’s StatSheet.
Year to date, here’s how our original candidates from the last cycle have fared:
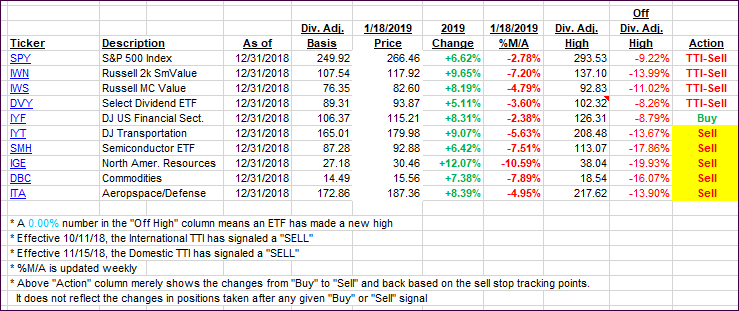
Again, the %M/A column above shows the position of the various ETFs in relation to their respective long-term trend lines, while the trailing sell stops are being tracked in the “Off High” column. The “Action” column will signal a “Sell” once the -8% point has been taken out in the “Off High” column. For more volatile sector ETFs, the trigger point is -10%.
- Trend Tracking Indexes (TTIs)
Our Trend Tracking Indexes (TTIs) rallied and moved closer to their respective trend lines.
Here’s how we closed 01/18/2019:
Domestic TTI: -1.96% below its M/A (last close -3.42%)—Sell signal effective 11/15/2018
International TTI: -2.75% below its M/A (last close -4.00%)—Sell signal effective 10/11/2018
Disclosure: I am obliged to inform you that I, as well as my advisory clients, own some of the ETFs listed in the above table. Furthermore, they do not represent a specific investment recommendation for you, they merely show which ETFs from the universe I track are falling.
————————————————————-
READER Q & As
All Reader Q & A’s are listed at our web site!
Check it out at:
https://theetfbully.com/questions-answers/
———————————————————-
WOULD YOU LIKE TO HAVE YOUR INVESTMENTS PROFESSIONALLY MANAGED?
Do you have the time to follow our investment plans yourself? If you are a busy professional who would like to have his portfolio managed using our methodology, please contact me directly or get more details at:
https://theetfbully.com/personal-investment-management/
———————————————————
Back issues of the ETF/No Load Fund Tracker are available on the web at:
https://theetfbully.com/newsletter-archives/
Contact Ulli
Comments 2
Hey, Ulli
You continuously assure us \ the algos drive the market, thereby making every move artificial. How, then, can we be sure that your Domestic TTI is still valid?
Smokey
1/18/19
Author
The TTI simply follows the trends, no matter how they’re generated…
Ulli…