
- Moving the markets
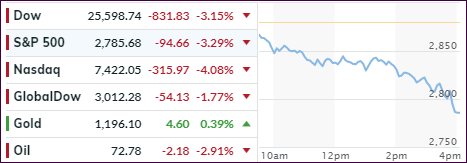
A slow deterioration of equity prices, which started last week, accelerated today with the broad markets plummeting, as the chart above shows. There was simply no place to hide and those investors, counting on the bond portion of their portfolios for safety, were disappointed as the 20-year bond ETF (TLT) dropped in sympathy with stocks bringing the YTD loss to over 10%.
Rising bond yields continue to be culprit causing uncertainty and extending this month’s losses while giving new meaning to the term “Red October,” The S&P 500 not only extended its slide for the 5th consecutive day but also fell below its 5-day M/A for the 4th session, creating doubt as to whether this level could serve as one of support.
The index has also reached a point that is only 20 points away from breaking through its 200-day M/A which, if broken, would very likely confirm more downside action and a return to bear market territory. What is concerning is that the magnitude of today’s correction, as opposed to the ones in February and March, happened in just one day.
Usually, you’d see some bobbing and weaving, along with a slow deterioration of prices, followed by more accelerated selling. Today, all happened at once which, to my way of thinking, could only mean 2 things:
- The sell-off was an outlier and simply overdone and is quickly followed by a rebound, or
- The bullish crowd just disappeared and computer algos will push this market lower and into bear market territory ending the current bullish cycle, which has only lasted this long due to the Fed’s QE and lower rates, both of which may now be a thing of the past
When looking at charts of the sectors that are fundamentally important for the economy, we see nothing but bearish trends in the following areas: Financials, Semiconductors, Home-builders, Autos, Materials, Copper, Lumber and credit markets. There is only one stock that appears to be holding up no matter what. This chart tells the story.
Our International Trend Tracking Index (TTI) went south again for the 4th day in a row and is now firmly entrenched on the bearish side of its trend line, thereby generating a “Sell” signal effective tomorrow.
The Domestic TTI just broke below its respective trend line today but only by a small margin. I will watch to see if the downward slide continues tomorrow but will for sure liquidate those positions that have triggered their trailing sell stops.
Be sure to see section 3 below for the exact positions of our Trend Tracking Indexes (TTIs).
- ETFs in the Spotlight
In case you missed the announcement and description of this section, you can read it here again.
It features 10 broadly diversified and sector ETFs from my HighVolume list as posted every Saturday. Furthermore, they are screened for the lowest MaxDD% number meaning they have been showing better resistance to temporary sell offs than all others over the past year.
The below table simply demonstrates the magnitude with which some of the ETFs are fluctuating regarding their positions above or below their respective individual trend lines (%M/A). A break below, represented by a negative number, shows weakness, while a break above, represented by a positive percentage, shows strength.
For hundreds of ETF choices, be sure to reference Thursday’s StatSheet.
Year to date, here’s how our candidates have fared so far:
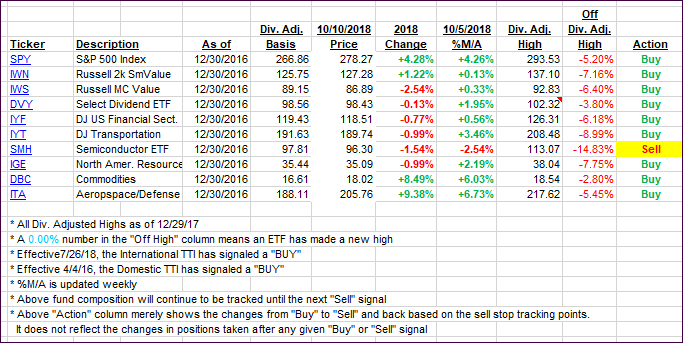
Again, the %M/A column above shows the position of the various ETFs in relation to their respective long-term trend lines, while the trailing sell stops are being tracked in the “Off High” column. The “Action” column will signal a “Sell” once the -8% point has been taken out in the “Off High” column. For more volatile sector ETFs, the trigger point is -10%.
- Trend Tracking Indexes (TTIs)
Our Trend Tracking Indexes (TTIs) dove sharply and closed below their respective trend lines. The International one has now generated a “Sell” signal effective 10/11/18.
The Domestic one just barely dipped below its line, and I will monitor it closely to evaluate “if or when” a “Sell” signal is applicable for this area as well.
Here’s how we closed 10/10/2018:
Domestic TTI: -0.38% below its M/A (last close +2.56%)—Buy signal effective 4/4/2016
International TTI: -2.27% below its M/A (last close -0.40%)—Sell signal effective 10/11/2018
Disclosure: I am obliged to inform you that I, as well as my advisory clients, own some of the ETFs listed in the above table. Furthermore, they do not represent a specific investment recommendation for you, they merely show which ETFs from the universe I track are falling within the guidelines specified.
Contact Ulli