
- Moving the markets
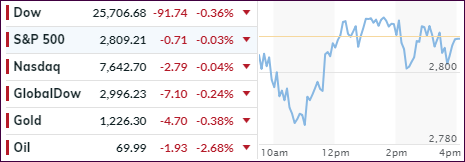
A sharp early dive pushed the Dow down some 250 points (thanks in part due to IBMs poor earnings report) shortly after the opening with the other major indexes seeing red numbers as well. A slow but steady recovery pulled the indexes back above their respective unchanged lines, but the gains did not hold, and we closed slightly down, a remarkable achievement given the lousy start to the session.
Throwing some cold water on the rebound was the release of the Fed minutes showing that most policy makers support the fact that interest rate hikes should continue to be implemented. Consequently, the 10-year bond yield jumped 2.5 basis points to close at 3.19%.
Economic numbers were disappointing to say the least, with the housing market showing weakness all the way around. Mortgage applications collapsed to 18-year lows, mostly due to 30-year fixed rates now exceeding 5%. Housing Starts resumed their September collapse by slumping 5.3%, while Permits disappointed because of a 18.9% breakdown in the MidWest.
Still, the markets managed to overcome the hawkish Fed minutes and poor data, but caution was the theme on Wall Street today, since volatility looks to stay with us as witnessed by this morning’s market breakdown. The positive is that most players on Wall Street still see a strong earnings season ahead supporting the bullish mood.
Regarding domestic major trend direction, we’re still stuck in the neutral zone. Our Domestic TTI (see section 3 below) slipped a tad but is stilling hanging on to the bullish side of the trend line by a scant +0.06%, which is hardly a position conducive to support either the bulls or the bears.
We will hold on and wait for more directional clarification and, depending on the outcome, will either add to current holdings or move all the way to cash. Right now, patience is the key to avoid any unnecessary whip-saw signals.
- ETFs in the Spotlight
In case you missed the announcement and description of this section, you can read it here again.
It features 10 broadly diversified and sector ETFs from my HighVolume list as posted every Saturday. Furthermore, they are screened for the lowest MaxDD% number meaning they have been showing better resistance to temporary sell offs than all others over the past year.
The below table simply demonstrates the magnitude with which some of the ETFs are fluctuating regarding their positions above or below their respective individual trend lines (%M/A). A break below, represented by a negative number, shows weakness, while a break above, represented by a positive percentage, shows strength.
For hundreds of ETF choices, be sure to reference Thursday’s StatSheet.
Year to date, here’s how our candidates have fared so far:
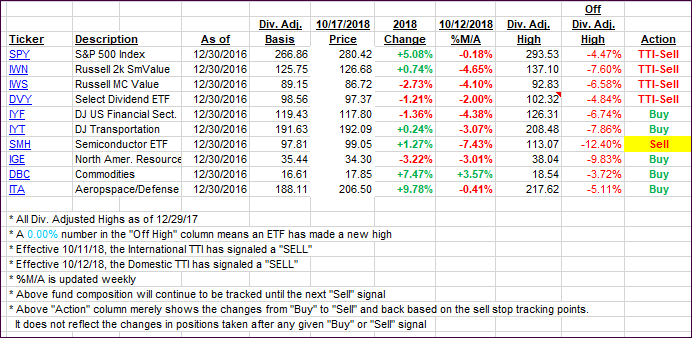
Again, the %M/A column above shows the position of the various ETFs in relation to their respective long-term trend lines, while the trailing sell stops are being tracked in the “Off High” column. The “Action” column will signal a “Sell” once the -8% point has been taken out in the “Off High” column. For more volatile sector ETFs, the trigger point is -10%.
- Trend Tracking Indexes (TTIs)
Our Trend Tracking Indexes (TTIs) with the Domestic one slipping and moving closer to bear market territory, while the International one has already solidified its position below the line.
Here’s how we closed 10/17/2018:
Domestic TTI: +0.06% above its M/A (last close +0.26%)—Sell signal effective 10/12/2018
International TTI: -2.61% below its M/A (last close -2.38%)—Sell signal effective 10/11/2018
Disclosure: I am obliged to inform you that I, as well as my advisory clients, own some of the ETFs listed in the above table. Furthermore, they do not represent a specific investment recommendation for you, they merely show which ETFs from the universe I track are falling within the guidelines specified.
Contact Ulli