
- Moving the markets
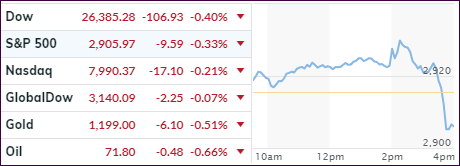
The Fed stepped up to the plate and delivered the 3rd 25 basis point interest rate hike this year, which was widely expected but hope for ‘accommodation’ still powered an early rally that ran out of steam once reality hit the markets.
The major indexes reversed course, headed south and closed marginally in the red. Furthermore, the Fed indicated that a 4th hike in December would be a distinct possibility and that 3 more might follow in 2019.
Bond yields took a dive and shaved off 5 basis points to close at 3.05%; a level last seen on September 19th. The US Dollar swung wildly intra-day, but the closing price of UUP was only +0.04% higher, which did not reflect the see-saw action of the session. The Bloomberg Dollar Index demonstrates the irrational exuberance shown over the past week as ZH quipped: “Does this remind you of a penny stock?”
We’ll have to see how the markets will digest the interest hike hangover over the next few days. It very well may simply present an additional uncertainty in the basket of “things to worry,” with tough trade talk, a weakening housing market and bloating federal debt rotating to compete for the headline of the day.
- ETFs in the Spotlight
In case you missed the announcement and description of this section, you can read it here again.
It features 10 broadly diversified and sector ETFs from my HighVolume list as posted every Saturday. Furthermore, they are screened for the lowest MaxDD% number meaning they have been showing better resistance to temporary sell offs than all others over the past year.
The below table simply demonstrates the magnitude with which some of the ETFs are fluctuating regarding their positions above or below their respective individual trend lines (%M/A). A break below, represented by a negative number, shows weakness, while a break above, represented by a positive percentage, shows strength.
For hundreds of ETF choices, be sure to reference Thursday’s StatSheet.
Year to date, here’s how our candidates have fared so far:
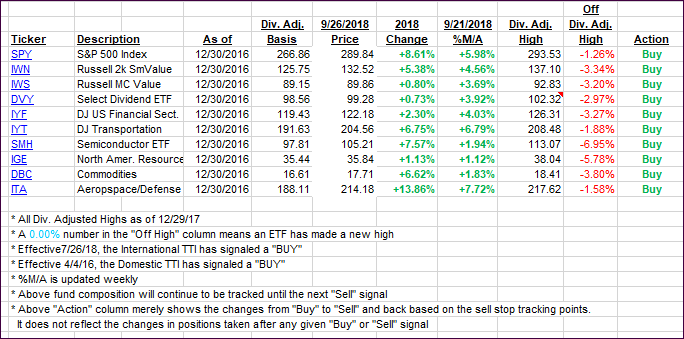
Again, the %M/A column above shows the position of the various ETFs in relation to their respective long-term trend lines, while the trailing sell stops are being tracked in the “Off High” column. The “Action” column will signal a “Sell” once the -8% point has been taken out in the “Off High” column. For more volatile sector ETFs, the trigger point is -10%.
- Trend Tracking Indexes (TTIs)
Our Trend Tracking Indexes (TTIs) slipped as the Fed took the punch-bowl away—at least for the day.
Here’s how we closed 09/26/2018:
Domestic TTI: +3.95% above its M/A (last close +4.35%)—Buy signal effective 4/4/2016
International TTI: +1.82% above its M/A (last close +1.89%)—Buy signal effective 7/26/2018
Disclosure: I am obliged to inform you that I, as well as my advisory clients, own some of the ETFs listed in the above table. Furthermore, they do not represent a specific investment recommendation for you, they merely show which ETFs from the universe I track are falling within the guidelines specified.
Contact Ulli