
- Moving the markets
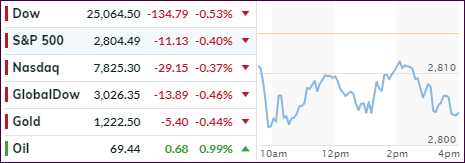
The Dow’s 5-day win streak came to an end today, as all 3 major indexes hit the skids and meandered below their respective unchanged lines throughout the session.
Trade war talk came to life suddenly and threatened bullish sentiment when Trump mentioned “tremendous retribution” not against China but this time against the European Union. Specifically, he addressed auto tariffs, should his meeting with EU officials next week not yield the desired “fair” results.
He also spooked the bond markets by remarking he wasn’t “thrilled” that the Fed was hiking rates, which put pressure on the financials with XLF getting spanked at the rate of -1.50%. While the 10-year bond dropped 4 basis points to 2.84%, equites in general were not impacted.
Earnings so far have been called “fantastic” by the Wall Street crowd, although some disappointments appeared this morning keeping buyers on the sidelines. However, to me it seems that the biggest scare was the sudden jawboning over trade wars. As I mentioned before, this is one powder keg that, once it explodes, could derail the earning season in a hurry.
Let’s see how things turns out when Trump travels to Europe next week.
- ETFs in the Spotlight
In case you missed the announcement and description of this section, you can read it here again.
It features 10 broadly diversified and sector ETFs from my HighVolume list as posted every Saturday. Furthermore, they are screened for the lowest MaxDD% number meaning they have been showing better resistance to temporary sell offs than all others over the past year.
The below table simply demonstrates the magnitude with which some of the ETFs are fluctuating regarding their positions above or below their respective individual trend lines (%M/A). A break below, represented by a negative number, shows weakness, while a break above, represented by a positive percentage, shows strength.
For hundreds of ETF choices, be sure to reference Thursday’s StatSheet.
Year to date, here’s how our candidates have fared so far:
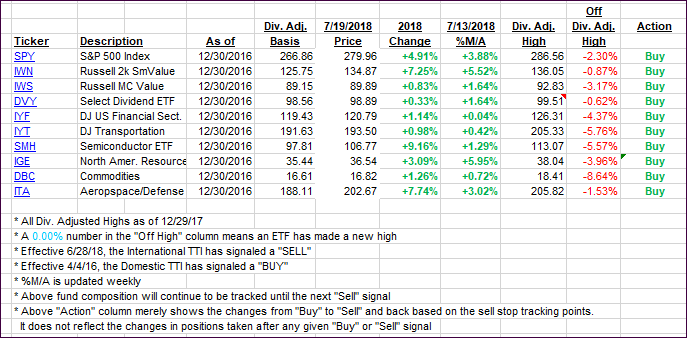
Again, the %M/A column above shows the position of the various ETFs in relation to their respective long-term trend lines, while the trailing sell stops are being tracked in the “Off High” column. The “Action” column will signal a “Sell” once the -7.5% point has been taken out in the “Off High” column.
- Trend Tracking Indexes (TTIs)
Our Trend Tracking Indexes (TTIs) both slipped just a tad, which had no effect on our current positions.
Here’s how we closed 07/19/2018:
Domestic TTI: +2.83% above its M/A (last close +2.90%)—Buy signal effective 4/4/2016
International TTI: +0.36% above its M/A (last close +0.65%)—Sell signal effective 6/28/2018
Disclosure: I am obliged to inform you that I, as well as my advisory clients, own some of the ETFs listed in the above table. Furthermore, they do not represent a specific investment recommendation for you, they merely show which ETFs from the universe I track are falling within the guidelines specified.
Contact Ulli