
- Moving the markets
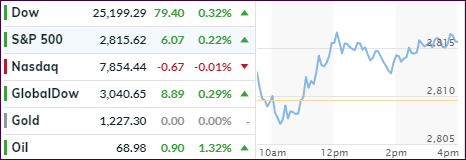
The major indexes followed through from yesterday’s advance to close higher with the Dow logging its fifth positive session, while the Nasdaq lagged slightly and fell just short of crossing its unchanged line to the upside.
The markets were still influenced by the Fed’s upbeat description of a domestic economy, which has expanded but is limited in further growth due to an alleged lack of skilled workers while, at the same time, rising material costs are the fly in the ointment to further expansion. Out of the 12 Fed districts, 11 of them were growing at a “modest” pace while one of them experienced “slight” growth. I am not sure if this is a worthwhile distinction.
In the end, Fed’s Powell repeated many of his assertions made yesterday and confirmed that interest rates will “continue to go up every three months for now.” Surprisingly, this firm statement had no effect on market behavior, but it made future rate hikes a little more predictable, while putting the pressure on upcoming earnings to keep the bullish meme going.
Taking top billing for the day were Transportations (IYT), which stormed ahead and gained a solid +2.27% (best day in 3 months) with Semiconductors taking a distant second with a respectable +1.02% performance.
Helping matters was the VIX, which was pushed down to the 11 level for the first time in a month. We’re now waiting to see if the much-hyped earnings season can live up to expectations to help the bullish cause.
- ETFs in the Spotlight
In case you missed the announcement and description of this section, you can read it here again.
It features 10 broadly diversified and sector ETFs from my HighVolume list as posted every Saturday. Furthermore, they are screened for the lowest MaxDD% number meaning they have been showing better resistance to temporary sell offs than all others over the past year.
The below table simply demonstrates the magnitude with which some of the ETFs are fluctuating regarding their positions above or below their respective individual trend lines (%M/A). A break below, represented by a negative number, shows weakness, while a break above, represented by a positive percentage, shows strength.
For hundreds of ETF choices, be sure to reference Thursday’s StatSheet.
Year to date, here’s how our candidates have fared so far:
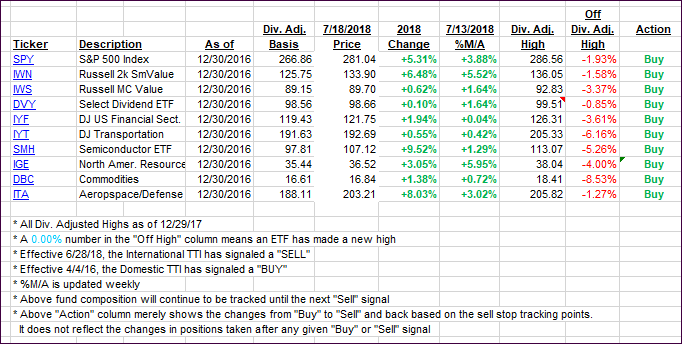
Again, the %M/A column above shows the position of the various ETFs in relation to their respective long-term trend lines, while the trailing sell stops are being tracked in the “Off High” column. The “Action” column will signal a “Sell” once the -7.5% point has been taken out in the “Off High” column.
- Trend Tracking Indexes (TTIs)
Our Trend Tracking Indexes (TTIs) edged up, but the International one remains at a level from which it could reverse in no time and consequently slip back below its trend line. Therefore, the “Sell” signal remains in effect.
Here’s how we closed 07/18/2018:
Domestic TTI: +2.90% above its M/A (last close +2.76%)—Buy signal effective 4/4/2016
International TTI: +0.65% above its M/A (last close +0.29%)—Sell signal effective 6/28/2018
Disclosure: I am obliged to inform you that I, as well as my advisory clients, own some of the ETFs listed in the above table. Furthermore, they do not represent a specific investment recommendation for you, they merely show which ETFs from the universe I track are falling within the guidelines specified.
Contact Ulli