
- Moving the markets
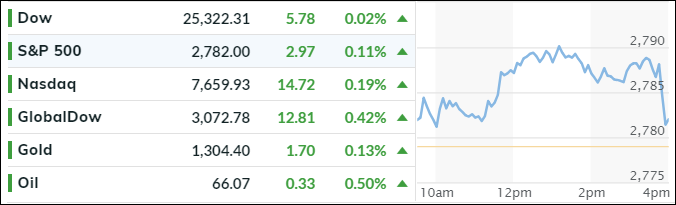
Market activity happened above the unchanged line today with the major indexes vacillating in bullish territory, where they closed, despite fading in the last few minutes. The reason for the late slip was nervousness about the highly anticipated summit between Trump and N. Korea’s Kim Jong Un scheduled for tomorrow.
8 of the 11 S&P’s sectors finished higher led by advances in Consumer Staples (XLP +0.83%), while Financials (XLF) and Utilities (XLU) declined modestly. The VIX had no effect and ended the session unchanged.
Interest rates were not a factor with the 10-year bond yield being stuck by trading within 2 basis points all day. The problem countries of the world, namely Brazil, Argentina and Italy continued their internal battles, with Brazilian Real doing an about face by heading sharply south while the Argentinian Peso crashed to new record lows.
Joining the group of weak currency suspects was Mexico, as its credit risk surged not only to the highest since the Trump election, but also above the credit risk of Russia for the first time in 10 years. Not to be outdone was Italy, whose bond yields plunged the most in 6 years, offsetting part of the recent spike, by being down an amazing 30 basis points for the 10-year yield.
The reason I’m pointing this out is that these events, caused by extreme currency and/or interest rate moves, are a sign that not all is well in the world of finance and reckless debt accumulation. Eventually, these distortions will affect equity markets, the timing of which, however, is the big unknown, which is why I consider them only an early warning sign and not a directional indicator.
- ETFs in the Spotlight
In case you missed the announcement and description of this section, you can read it here again.
It features 10 broadly diversified and sector ETFs from my HighVolume list as posted every Saturday. Furthermore, they are screened for the lowest MaxDD% number meaning they have been showing better resistance to temporary sell offs than all others over the past year.
The below table simply demonstrates the magnitude with which some of the ETFs are fluctuating regarding their positions above or below their respective individual trend lines (%M/A). A break below, represented by a negative number, shows weakness, while a break above, represented by a positive percentage, shows strength.
For hundreds of ETF choices, be sure to reference Thursday’s StatSheet.
Year to date, here’s how our candidates have fared so far:
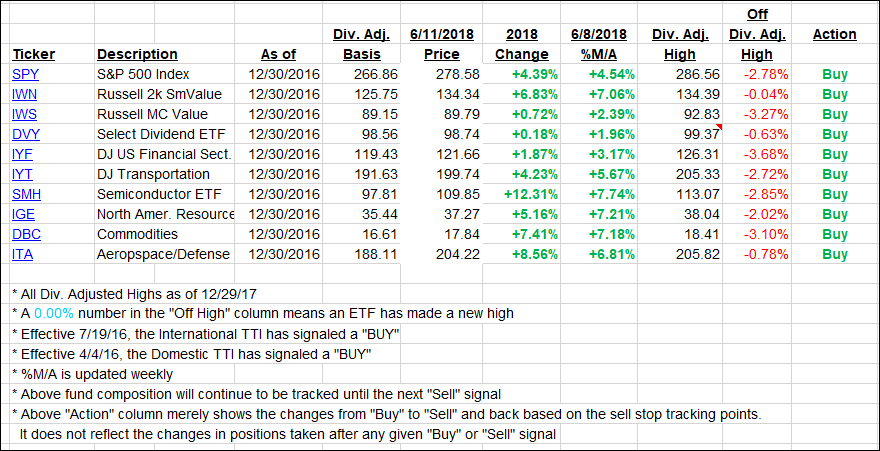
Again, the %M/A column above shows the position of the various ETFs in relation to their respective long-term trend lines, while the trailing sell stops are being tracked in the “Off High” column. The “Action” column will signal a “Sell” once the -7.5% point has been taken out in the “Off High” column.
- Trend Tracking Indexes (TTIs)
Our Trend Tracking Indexes (TTIs) headed north as the mood was slightly bullish.
Here’s how we closed 06/11/2018:
Domestic TTI: +2.74% above its M/A (last close +2.65%)—Buy signal effective 4/4/2016
International TTI: +2.08% below its M/A (last close +1.62%)—Buy signal effective 7/19/2016
Disclosure: I am obliged to inform you that I, as well as my advisory clients, own some of the ETFs listed in the above table. Furthermore, they do not represent a specific investment recommendation for you, they merely show which ETFs from the universe I track are falling within the guidelines specified.
Contact Ulli