
- Moving the markets
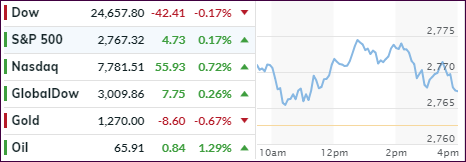
The market’s divergence continues with the Dow struggling and notching its 7th straight losing day, which is its longest streak since early 2017.
In contrast, the Nasdaq continued to blast higher, along with SmallCaps, seemingly not yet negatively affected by the worsening trade battle between the U.S. and China but instead receiving a strong assist by the continued short squeeze.
As ZH pointed out, not only have 13 of the last 15 days seen “most shorted” stocks rise, it’s also been the biggest short squeeze in the history of the data. Just look at the parabolic rise in the S&P stocks. Makes me wonder if this could be a blow-off top?
Interest rates rose modestly with the 10-year bond yield adding 4 basis points to end at 2.93%, which is still a respectful distance from the 3% level that has been troublesome in the past.
Today’s market activity had the feel of a relief rally, despite Trump increasing the rhetoric with the Chinese last night when accusing them of “waging a systematic campaign of economic aggression.” Not exactly soothing words for the Wall Street crowd but sufficient to at least temporarily halt the downward swing in the broader markets.
Our Trend Tracking Indexes (TTIs) recovered with the International one remaining in striking distance of breaking through its trend line to the downside and signaling a “Sell.” See section 3 for more details.
It appears, the markets have not yet priced in any potential global issues affecting earnings negatively, should these trade talks stay in that fragile state as they’ve been. Things could explode in a hurry, which is why we need to be prepared to deal with a sudden turnaround in sentiment or possibly stay on board a while longer until more consequences become obvious.
- ETFs in the Spotlight
In case you missed the announcement and description of this section, you can read it here again.
It features 10 broadly diversified and sector ETFs from my HighVolume list as posted every Saturday. Furthermore, they are screened for the lowest MaxDD% number meaning they have been showing better resistance to temporary sell offs than all others over the past year.
The below table simply demonstrates the magnitude with which some of the ETFs are fluctuating regarding their positions above or below their respective individual trend lines (%M/A). A break below, represented by a negative number, shows weakness, while a break above, represented by a positive percentage, shows strength.
For hundreds of ETF choices, be sure to reference Thursday’s StatSheet.
Year to date, here’s how our candidates have fared so far:
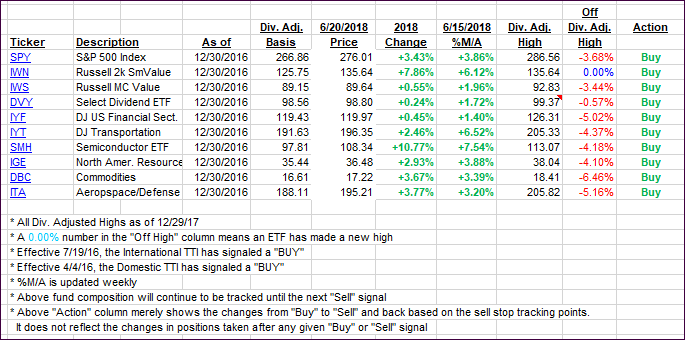
Again, the %M/A column above shows the position of the various ETFs in relation to their respective long-term trend lines, while the trailing sell stops are being tracked in the “Off High” column. The “Action” column will signal a “Sell” once the -7.5% point has been taken out in the “Off High” column.
- Trend Tracking Indexes (TTIs)
Our Trend Tracking Indexes (TTIs) recovered and closed up for a change, however, the International one still remains in “danger” territory, which simply means it will not take much of a downdraft to break its trend line and generate a “Sell” signal.
Here’s how we closed 06/20/2018:
Domestic TTI: +2.82% above its M/A (last close +2.65%)—Buy signal effective 4/4/2016
International TTI: +0.31% above its M/A (last close +0.05%)—Buy signal effective 7/19/2016
Disclosure: I am obliged to inform you that I, as well as my advisory clients, own some of the ETFs listed in the above table. Furthermore, they do not represent a specific investment recommendation for you, they merely show which ETFs from the universe I track are falling within the guidelines specified.
Contact Ulli