
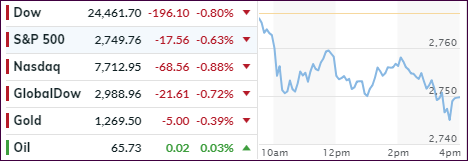
- Moving the markets
It appears that finally the U.S. equity markets got the message that not all is well with the world, as the gloomy trade news and a host of other events combined forces to not only push the major indexes below the unchanged line right after the opening bell, but also keep them there for the entire session.
The Dow has now closed in the red for 8 straight days, which ties its worst losing streak in some 40 years. The “most shorted” stocks found some relief by ending up having a long hoped for down day. The FANG stocks dipped and ripped but ended lower for the day.
The VIX supported the bearish mood by rising above the 15 level (rising VIX is bearish and vice versa), a point at which in the recent past dip-buyers have stepped in, however, today, they were conspicuously absent.
Regarding important data points, the headlines were simply not conducive to bring out the bulls, maybe in part due to some of these reasons:
- The Philly Fed (business optimism/pessimism) crashed the most in 4 years
- Italian fears back on the front burner with the appointment of 2 Euro skeptics to their parliament
- Internet stocks skidded as SCOTUS rules in favor of internet tax collection
- Dollar plummeted but limited losses late in the session
In the end, I suspect that maybe, just maybe, today the reality became clear that the actual implementation of trade tariffs will cause retaliations of equal or greater impact.
Our Trend Tracking Indexes (TTIs) slipped again with the Domestic one remaining on the bullish side of its trend line. The International one slipped below its dividing line between bullish and bearish territory by a small -0.36%. See section 3 for my plan of action.
- ETFs in the Spotlight
In case you missed the announcement and description of this section, you can read it here again.
It features 10 broadly diversified and sector ETFs from my HighVolume list as posted every Saturday. Furthermore, they are screened for the lowest MaxDD% number meaning they have been showing better resistance to temporary sell offs than all others over the past year.
The below table simply demonstrates the magnitude with which some of the ETFs are fluctuating regarding their positions above or below their respective individual trend lines (%M/A). A break below, represented by a negative number, shows weakness, while a break above, represented by a positive percentage, shows strength.
For hundreds of ETF choices, be sure to reference Thursday’s StatSheet.
Year to date, here’s how our candidates have fared so far:
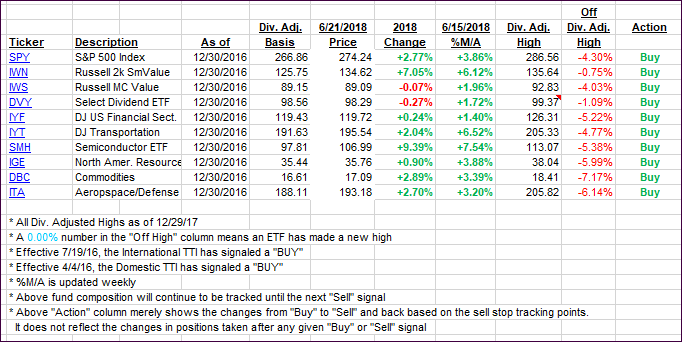
Again, the %M/A column above shows the position of the various ETFs in relation to their respective long-term trend lines, while the trailing sell stops are being tracked in the “Off High” column. The “Action” column will signal a “Sell” once the -7.5% point has been taken out in the “Off High” column.
- Trend Tracking Indexes (TTIs)
Our Trend Tracking Indexes (TTIs) both headed south, but only the International one crossed its trend line into negative territory, although by only a fraction of a percent. This constitutes a “Sell” signal for “broadly diversified international ETFs.”
However, to avoid a potential whip-saw signal, meaning a ‘Sell’ shortly thereafter followed by a new ‘Buy,’ I will play it this way:
Once the markets open tomorrow and seem to be steady or rebounding, I will hold off liquidating our international positions for another day.
If the international markets continue to slip, I will sell 50% of our affected holdings. That will allow me to still be in the market, should a turnaround occur.
If, however, there is a severe sell-off, I will take that as a clue that this Buy cycle has come to an end and will get out of 100% of our international holdings.
Remember, the goal here is not react to the whims of the market place but to avoid the big drops such as we’ve seen in 2008. We may very well be close, and the International TTI could again be the canary in the coalmine with its Domestic cousin being on deck.
Here’s how we closed 06/21/2018:
Domestic TTI: +2.46% above its M/A (last close +2.82%)—Buy signal effective 4/4/2016
International TTI: -0.36% below its M/A (last close +0.31%)—Buy signal effective 7/19/2016
Disclosure: I am obliged to inform you that I, as well as my advisory clients, own some of the ETFs listed in the above table. Furthermore, they do not represent a specific investment recommendation for you, they merely show which ETFs from the universe I track are falling within the guidelines specified.
Contact Ulli