
- Moving the markets
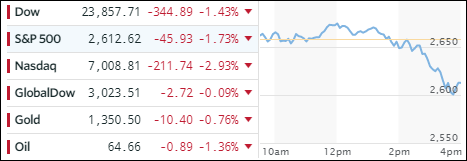
And it all started so peacefully. The markets opened on the plus side, after Monday’s euphoric rebound, when, after hugging the unchanged line for a while, the bottom suddenly dropped out, and the tech sector (-3.5%) did its best imitation of a swan dive pulling the entire equity arena with it. In the end, most of yesterday’s broad gains were given back.
Headlines engulfed the tech sector ranging from self-driving car issues, Tesla probe, Facebook hearings and reports that Google and Twitter may be pulled into the social media frenzy as well.
The S&P 500 tumbled -1.73% and is now again within striking distance of reaching its widely watched 200-day M/A, a break below of which might have dire consequences and could accelerate downside momentum.
As the VIX spiked, US banks got hammered after a nice showing yesterday. Commodities and Energy were hit hard. Bond yields tumbled with the 10-year giving back 7 basis points to 2.78%, its lowest since early February. The US Dollar (UUP) rebounded sharply overnight, pulled back and settled for a gain of +0.47%.
While none of our trailing sell stops were triggered, our Trend Tracking Indexes (TTI) slipped again closer to a potential “Sell” signal with especially the international one getting close. Please see the details in section 3 below.
- ETFs in the Spotlight
In case you missed the announcement and description of this section, you can read it here again.
It features 10 broadly diversified and sector ETFs from my HighVolume list as posted every Saturday. Furthermore, they are screened for the lowest MaxDD% number meaning they have been showing better resistance to temporary sell offs than all others over the past year.
The below table simply demonstrates the magnitude with which some of the ETFs are fluctuating in regards to their positions above or below their respective individual trend lines (%M/A). A break below, represented by a negative number, shows weakness, while a break above, represented by a positive percentage, shows strength.
For hundreds of ETF choices, be sure to reference Thursday’s StatSheet.
Year to date, here’s how our candidates have fared so far:
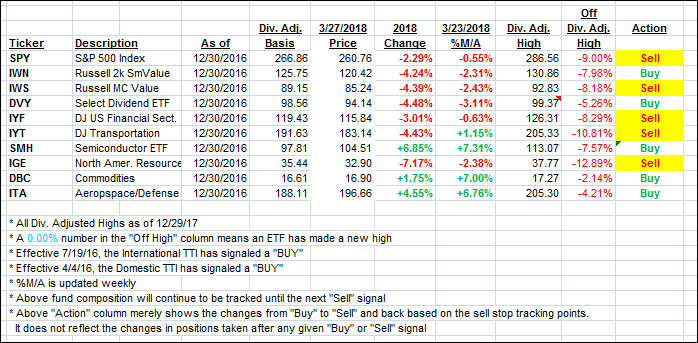
Again, the %M/A column above shows the position of the various ETFs in relation to their respective long term trend lines, while the trailing sell stops are being tracked in the “Off High” column. The “Action” column will signal a “Sell” once the -7.5% point has been taken out in the “Off High” column.
- Trend Tracking Indexes (TTIs)
Our Trend Tracking Indexes (TTIs) took a dive and closed lower with the International one reaching the strike zone again. Stay tuned!
Here’s how we closed 3/27/2018:
Domestic TTI: +1.10% above its M/A (last close +1.89%)—Buy signal effective 4/4/2016
International TTI: +0.28% above its M/A (last close +1.36%)—Buy signal effective 7/19/2016
Disclosure: I am obliged to inform you that I, as well as my advisory clients, own some of the ETFs listed in the above table. Furthermore, they do not represent a specific investment recommendation for you, they merely show which ETFs from the universe I track are falling within the guidelines specified.
Contact Ulli