
- Moving the markets
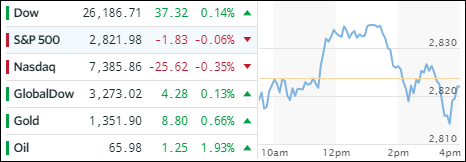
It was another roller coaster ride with the indexes vacillating around their unchanged lines. A nice mid-day rally fizzled out and accelerated to the downside in the last hour when dip buyers stepped in to limit the damage. Volatility picked up due to rising interest rates and inflation along with uncertainty ahead of tomorrow’s jobs report.
The mixed picture carried over to ETF land where winners and losers were just about evenly matched. Bucking the bearish trend were Financials (XLF +0.94%), Aerospace & Defense (ITA +0.57%) and International SmallCaps (SCHC +0.42%). On the other end of the spectrum, we saw Emerging Markets (SCHE -1.41%), Semiconductors (SMH -0.61%) and Transportations (IYT -0.56%) closing in the red.
The bond arena saw a bloodbath today with the yield on 10-year jumping 6 basis points to 2.78%, a level last seen in April 2014, while the 30-year climbed above the 3% level to end the session at 3.01%. As a result, bond prices plunged with the widely held 20-year (TLT) losing -1.45%, which it had last visited in May last year.
If you are wondering how the US dollar (UUP) fared in this environment, it should come as no surprise that it got spanked as well (-0.52%), or monkey hammered as some analysts referred to it. But, but, as President Trump recently confirmed, we have a strong dollar policy. Go figure…
- ETFs in the Spotlight
In case you missed the announcement and description of this section, you can read it here again.
It features 10 broadly diversified and sector ETFs from my HighVolume list as posted every Saturday. Furthermore, they are screened for the lowest MaxDD% number meaning they have been showing better resistance to temporary sell offs than all others over the past year.
The below table simply demonstrates the magnitude with which some of the ETFs are fluctuating in regards to their positions above or below their respective individual trend lines (%M/A). A break below, represented by a negative number, shows weakness, while a break above, represented by a positive percentage, shows strength.
For hundreds of ETF choices, be sure to reference Thursday’s StatSheet.
Year to date, here’s how our candidates have fared so far:
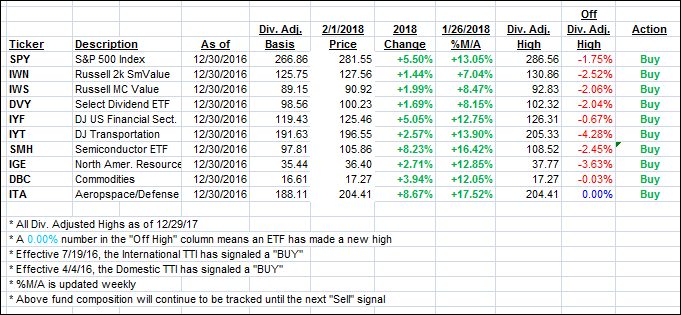
Again, the %M/A column above shows the position of the various ETFs in relation to their respective long term trend lines, while the trailing sell stops are being tracked in the “Off High” column. The “Action” column will signal a “Sell” once the -7.5% point has been taken out in the “Off High” column.
- Trend Tracking Indexes (TTIs)
Our Trend Tracking Indexes (TTIs) were mixed with the Domestic one slipping and the International one gaining.
Here’s how we closed 2/1/2018:
Domestic TTI: +4.64% above its M/A (last close +4.70%)—Buy signal effective 4/4/2016
International TTI: +8.30% above its M/A (last close +8.16%)—Buy signal effective 7/19/2016
Disclosure: I am obliged to inform you that I, as well as my advisory clients, own some of the ETFs listed in the above table. Furthermore, they do not represent a specific investment recommendation for you, they merely show which ETFs from the universe I track are falling within the guidelines specified.
Contact Ulli