
- Moving the markets
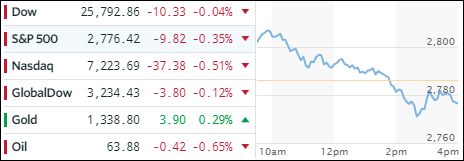
Right after the opening bell, the major indexes stormed ahead to set new records, only to be reminded that nothing goes up forever without a break or some sort of a pullback. The Dow raced past the 26k milestone only seven days after having conquered its 25k level, which was triple the pace of the 24k to 25k advance. Then some reality set in, and we went backwards in an almost straight line and closed in the red.
There was no particular event for this sudden reversal other than the realization that we may have come too far too fast over the past 12 months. Still, earnings season is ahead of us and will most likely support the underlying bullish mood.
The sea of red spilled over to the ETF space we are following with only Semiconductors (SMH +0.46%) and International SmallCaps (SCHC +0.08%) showing gains. On the downside, Transportations (IYT -1.37%) were leading, followed by US SmallCaps (SCHA -1.20%) and Aerospace & Defense (ITA -1.07%).
Interest rates slipped a tad with the yield on the 10-year bond giving back 1 basis point to close at 2.54%, which was enough of a pullback to allow the 20-year bond (TLT) to gain +0.42%. Gold was shining by bucking the negative equity trend and gaining +0.29% to end the day at $1,338. Not so lucky was the US Dollar (UUP) which, despite an early session rally, ended up gapping down sharply, losing -0.55%, and closing at a level last seen in December 2015. Ouch.
- ETFs in the Spotlight
In case you missed the announcement and description of this section, you can read it here again.
It features 10 broadly diversified and sector ETFs from my HighVolume list as posted every Saturday. Furthermore, they are screened for the lowest MaxDD% number meaning they have been showing better resistance to temporary sell offs than all others over the past year.
The below table simply demonstrates the magnitude with which some of the ETFs are fluctuating in regards to their positions above or below their respective individual trend lines (%M/A). A break below, represented by a negative number, shows weakness, while a break above, represented by a positive percentage, shows strength.
For hundreds of ETF choices, be sure to reference Thursday’s StatSheet.
Year to date, here’s how our candidates have fared so far:
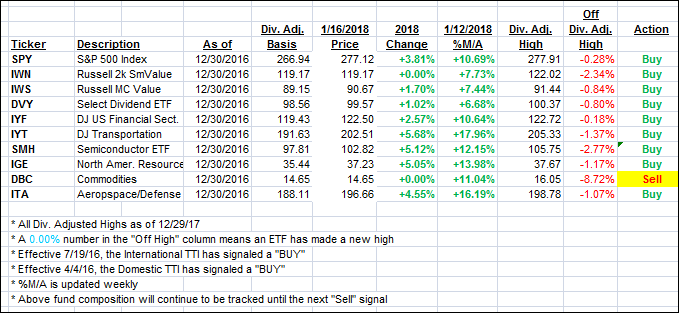
Again, the %M/A column above shows the position of the various ETFs in relation to their respective long term trend lines, while the trailing sell stops are being tracked in the “Off High” column. The “Action” column will signal a “Sell” once the -7.5% point has been taken out in the “Off High” column.
- Trend Tracking Indexes (TTIs)
Our Trend Tracking Indexes (TTIs) were mixed as this reversal day left the bears in charge—at least for this session.
Here’s how we closed 1/16/2018:
Domestic TTI: +4.62% above its M/A (last close +4.78%)—Buy signal effective 4/4/2016
International TTI: +8.23% above its M/A (last close +8.13%)—Buy signal effective 7/19/2016
Disclosure: I am obliged to inform you that I, as well as my advisory clients, own some of the ETFs listed in the above table. Furthermore, they do not represent a specific investment recommendation for you, they merely show which ETFs from the universe I track are falling within the guidelines specified.
Contact Ulli