
- Moving the markets
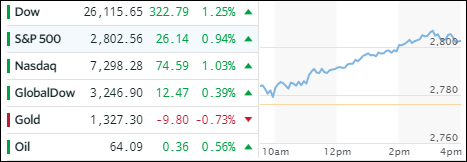
Yesterday’s pull-back proved to be ephemeral when considering the runaway train the major indexes resembled today. Looking at the chart above, it was about as straight of an ascending line as you can paint, as the bulls took charge again and pushed the major indexes into new all-time high territory.
The Dow led the rebound effort and ended solidly above the 26k level for the first time. Giving an assist was the release of the Fed’s beige book, which indicated an optimistic outlook for 2018 for most of the country.
Even the ever increasing possibility of a government shutdown this weekend could not damp the bullish mood. Either a possible shutdown is seen as a positive, or it’s the best kept secret that ruling politicians will actually let it happen. Take your pick…
The enthusiasm did spread to the ETF space as well with green being the only color of the day. Heading today’s ramp-a-thon were Semiconductors (SMH) with a chest pounding +2.99%. Following in its shadow with impressive results were Emerging Markets (SCHE +1.53%), the Dividend ETF (SCHD +1.50%) and LargeCaps (SCHX +0.94%). Transportations (IYT) lagged but ended to the plus side with +0.32%.
Interest rates rose with the yield on the 10-year bond gaining 3 basis points to end the day at 2.57%, its highest level since December 2016. The US Dollar (UUP) showed some strange behavior today by pumping, dumping and pumping again and then leaving the just reached December 2014 level behind to close up for the first time in 5 trading days.
- ETFs in the Spotlight
In case you missed the announcement and description of this section, you can read it here again.
It features 10 broadly diversified and sector ETFs from my HighVolume list as posted every Saturday. Furthermore, they are screened for the lowest MaxDD% number meaning they have been showing better resistance to temporary sell offs than all others over the past year.
The below table simply demonstrates the magnitude with which some of the ETFs are fluctuating in regards to their positions above or below their respective individual trend lines (%M/A). A break below, represented by a negative number, shows weakness, while a break above, represented by a positive percentage, shows strength.
For hundreds of ETF choices, be sure to reference Thursday’s StatSheet.
Year to date, here’s how our candidates have fared so far:
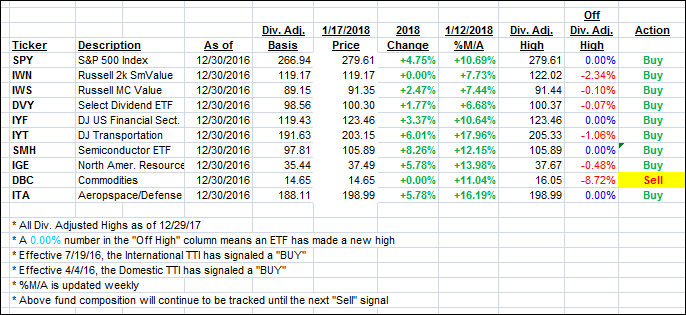
Again, the %M/A column above shows the position of the various ETFs in relation to their respective long term trend lines, while the trailing sell stops are being tracked in the “Off High” column. The “Action” column will signal a “Sell” once the -7.5% point has been taken out in the “Off High” column.
- Trend Tracking Indexes (TTIs)
Our Trend Tracking Indexes (TTIs) rocketed higher as the major indexes raced into record territory again.
Here’s how we closed 1/17/2018:
Domestic TTI: +5.01% above its M/A (last close +4.62%)—Buy signal effective 4/4/2016
International TTI: +8.61% above its M/A (last close +8.23%)—Buy signal effective 7/19/2016
Disclosure: I am obliged to inform you that I, as well as my advisory clients, own some of the ETFs listed in the above table. Furthermore, they do not represent a specific investment recommendation for you, they merely show which ETFs from the universe I track are falling within the guidelines specified.
Contact Ulli