
- Moving the markets
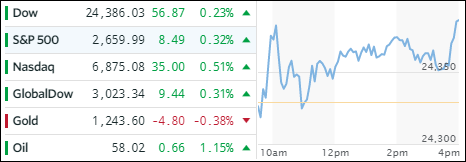
All 3 major indexes started the week in rally mode and finished solidly in the green, but only the Dow and S&P 500 set new record highs despite the Nasdaq scoring the best. The NY city terrorist incident disrupted the bullish mood only briefly, and the rally resumed. The main focus for traders was the Fed’s two-day meeting on interest rates with the results to be released on Wednesday. Expectations are just about 100% that they will deliver their third and last rate hike (1/4%) for 2017.
The ETF space I follow saw more green than red numbers. On the plus side, Emerging Markets (SCHE) ruled with a gain of +0.66%, which was closely followed by Semiconductors (SMH) with +0.61% and LargeCaps (SCHX) with +0.30%. Aerospace & Defense (ITA) gave back -0.67% along with Transportations (IYT), which surrendered -0.25%.
Interest rates headed north with the 10-year bond yield climbing 1 basis point. Gold slipped and Crude Oil gained +1.15%. The US dollar (UUP) round tripped and managed to cut its mid-day losses to end the session unchanged.
- ETFs in the Spotlight (updated for 2017)
In case you missed the announcement and description of this section, you can read it here again.
It features 10 broadly diversified and sector ETFs from my HighVolume list as posted every Saturday. Furthermore, they are screened for the lowest MaxDD% number meaning they have been showing better resistance to temporary sell offs than all others over the past year.
The below table simply demonstrates the magnitude with which some of the ETFs are fluctuating in regards to their positions above or below their respective individual trend lines (%M/A). A break below, represented by a negative number, shows weakness, while a break above, represented by a positive percentage, shows strength.
For hundreds of ETF choices, be sure to reference Thursday’s StatSheet.
Year to date, here’s how the 2017 candidates have fared so far:
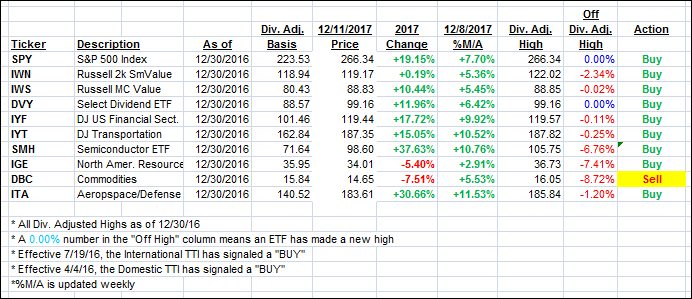
Again, the %M/A column above shows the position of the various ETFs in relation to their respective long term trend lines, while the trailing sell stops are being tracked in the “Off High” column. The “Action” column will signal a “Sell” once the -7.5% point has been taken out in the “Off High” column.
- Trend Tracking Indexes (TTIs)
Our Trend Tracking Indexes (TTIs) closed up as the bullish mood prevailed.
Here’s how we closed 12/11/2017:
Domestic TTI: +3.43% above its M/A (last close +3.38%)—Buy signal effective 4/4/2016
International TTI: +5.58% above its M/A (last close +5.37%)—Buy signal effective 7/19/2016
Disclosure: I am obliged to inform you that I, as well as my advisory clients, own some of the ETFs listed in the above table. Furthermore, they do not represent a specific investment recommendation for you, they merely show which ETFs from the universe I track are falling within the guidelines specified.
Contact Ulli