
- Moving the markets
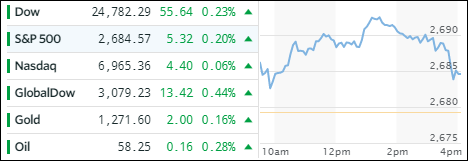
With the tax reform package now being a done deal, the markets were in need of a new catalyst to continue their bullish theme. Since there was none to speak of, equities simply rallied higher because… well… that’s what they do. Energy, Financials and Telecom contributed to the positive outcome, but the mid-session highs of the major indexes were unsustainable, and we slipped into the close.
In the end, our most widely followed ETFs had some pluses and minuses with the overall outcome being positive. Taking the lead for the day were Emerging Markets (SCHE) with +0.88% closely followed by Financials (XLF) with +0.82%. On the downside, we saw Semiconductors (SMH) giving back -1.04% while the Dividend ETF (SCHD) surrendered a more modest -0.21%.
Interest rates dropped slightly allowing the 20-year bond (TLT) to finally show a green close (+0.37%) after 3 days of devastating losses. Gold and Crude Oil ended slightly higher as the US Dollar (UUP) went predominantly sideways and closed down a tiny -0.04%.
- ETFs in the Spotlight
In case you missed the announcement and description of this section, you can read it here again.
It features 10 broadly diversified and sector ETFs from my HighVolume list as posted every Saturday. Furthermore, they are screened for the lowest MaxDD% number meaning they have been showing better resistance to temporary sell offs than all others over the past year.
The below table simply demonstrates the magnitude with which some of the ETFs are fluctuating in regards to their positions above or below their respective individual trend lines (%M/A). A break below, represented by a negative number, shows weakness, while a break above, represented by a positive percentage, shows strength.
For hundreds of ETF choices, be sure to reference Thursday’s StatSheet.
Year to date, here’s how the 2017 candidates have fared so far:
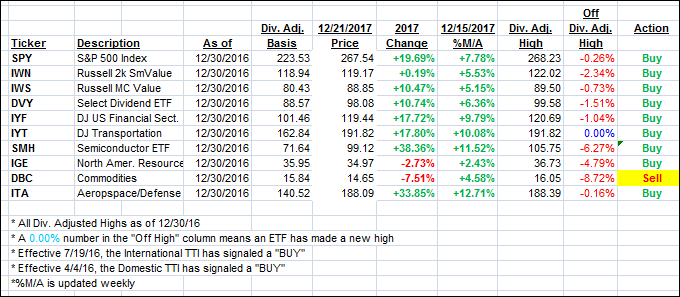
Again, the %M/A column above shows the position of the various ETFs in relation to their respective long term trend lines, while the trailing sell stops are being tracked in the “Off High” column. The “Action” column will signal a “Sell” once the -7.5% point has been taken out in the “Off High” column.
- Trend Tracking Indexes (TTIs)
Our Trend Tracking Indexes (TTIs) headed north by a small margin as the major indexes closed in the green.
Here’s how we closed 12/21/2017:
Domestic TTI: +4.07% above its M/A (last close +4.00%)—Buy signal effective 4/4/2016
International TTI: +5.19% above its M/A (last close +4.79%)—Buy signal effective 7/19/2016
Disclosure: I am obliged to inform you that I, as well as my advisory clients, own some of the ETFs listed in the above table. Furthermore, they do not represent a specific investment recommendation for you, they merely show which ETFs from the universe I track are falling within the guidelines specified.
Contact Ulli