
- Moving the markets
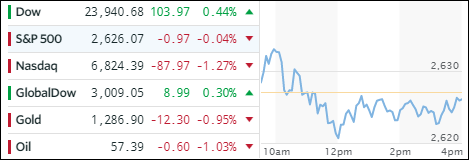
It’s really no surprise that the best performing sector of 2017 had to eventually come off its lofty levels and back to reality. That moment was today as, despite nine of the 11 S&P sectors gaining, Semiconductors (SMH) took a hit at the rate of -4.24%. Autodesk (ADSK) announced some earnings and restructuring plans that left the tech sector in the dust—at least for the day. However, considering that SMH was up over 45% YTD, a pullback like this had to be expected.
On the other side of the spectrum, the Dow ignored the bad news and sprinted again into record territory, while the S&P was not quite able to climb above the unchanged line. The ETF space affecting our portfolios was mixed and other areas made up for the Nasdaq’s weakness. Leading to the upside were Transportations (IYT) with a chest pounding +3.40% gain, which was followed by the Financials (XLF), which advanced +1.71%. Besides the Semiconductors dropping, we saw Emerging Markets (SCHE) surrendering -1.53%.
Interest rates rose with the yield on the 10-year bond gaining 3 basis points, which was enough to send the price of the 20-year bond (TLT) sharply lower by -0.99%. The effect on the High Yield sector (HYG) was only moderate with a loss of -0.13%. In a repeat from yesterday, both gold and oil slipped again while the US Dollar (UUP) traded in a tight range and ended up giving back -0.04%.
- ETFs in the Spotlight (updated for 2017)
In case you missed the announcement and description of this section, you can read it here again.
It features 10 broadly diversified and sector ETFs from my HighVolume list as posted every Saturday. Furthermore, they are screened for the lowest MaxDD% number meaning they have been showing better resistance to temporary sell offs than all others over the past year.
The below table simply demonstrates the magnitude with which some of the ETFs are fluctuating in regards to their positions above or below their respective individual trend lines (%M/A). A break below, represented by a negative number, shows weakness, while a break above, represented by a positive percentage, shows strength.
For hundreds of ETF choices, be sure to reference Thursday’s StatSheet.
Year to date, here’s how the 2017 candidates have fared so far:
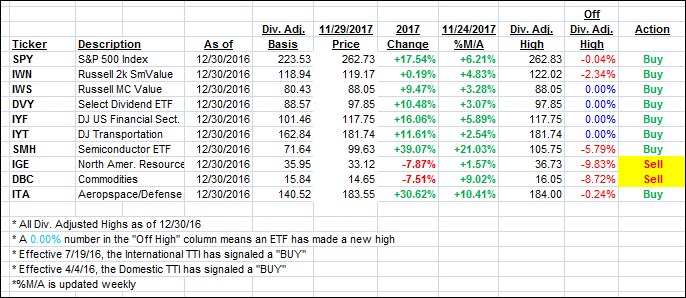 Again, the %M/A column above shows the position of the various ETFs in relation to their respective long term trend lines, while the trailing sell stops are being tracked in the “Off High” column. The “Action” column will signal a “Sell” once the -7.5% point has been taken out in the “Off High” column.
- Trend Tracking Indexes (TTIs)
Our Trend Tracking Indexes (TTIs) pulled back as momentum showed a mixed picture.
Here’s how we closed 11/29/2017:
Domestic TTI: +3.50% above its M/A (last close +3.72%)—Buy signal effective 4/4/2016
International TTI: +6.02% above its M/A (last close +6.18%)—Buy signal effective 7/19/2016
Disclosure: I am obliged to inform you that I, as well as my advisory clients, own some of the ETFs listed in the above table. Furthermore, they do not represent a specific investment recommendation for you, they merely show which ETFs from the universe I track are falling within the guidelines specified.
Contact Ulli