
- Moving the Markets
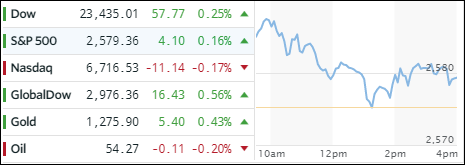
While the major indexes started the first November session with a bang, upward momentum waned, and the Nasdaq ended up slipping slightly into the red, while the Dow and S&P 500 remained green. The Fed kept interest rates unchanged but jawboned some positives about the economy using descriptive words like “activity has been picking up at a solid rate.” That’s an improvement in language over September when “moderate” was the term used to describe current goings-on.
On deck is Trump’s upcoming announcement on who will become the next Fed chair. At this time it looks to be Jerome Powell, whose dovish attitude towards interest rates is well known, which could be a positive for equities. The Earnings season has been viewed as strong so far with 75% of S&P companies having beaten analysts’ estimates.
The ETF space was mixed with winners and losers pretty much balanced. Heading higher were International SmallCaps (SCHC) with +0.50% and the Dividend ETF (SCHD) with +0.37%. On the losing side, we saw US SmallCaps (SCHA) take the lead by retreating -0.51%, closely followed by Semiconductors (SMH) with -0.27%.
Interest rates were mixed as well with the 10-year bond dropping 1 basis point to 2.37%. Yields have now been bouncing in a wide trading range since mid-April within a low of 2.05% and a high of 2.46%. Sooner or later a breakout will occur and determine the true direction of the major trend. The US dollar (UUP) was subdued as well but closed up +0.20%.
- ETFs in the Spotlight (updated for 2017)
In case you missed the announcement and description of this section, you can read it here again.
It features 10 broadly diversified and sector ETFs from my HighVolume list as posted every Saturday. Furthermore, they are screened for the lowest MaxDD% number meaning they have been showing better resistance to temporary sell offs than all others over the past year.
The below table simply demonstrates the magnitude with which some of the ETFs are fluctuating in regards to their positions above or below their respective individual trend lines (%M/A). A break below, represented by a negative number, shows weakness, while a break above, represented by a positive percentage, shows strength.
For hundreds of ETF choices, be sure to reference Thursday’s StatSheet.
Year to date, here’s how the 2017 candidates have fared so far:
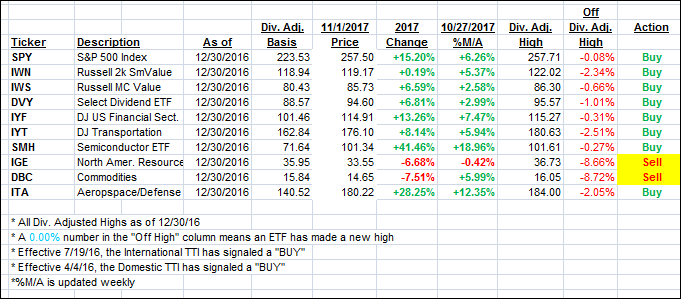
Again, the %M/A column above shows the position of the various ETFs in relation to their respective long term trend lines, while the trailing sell stops are being tracked in the “Off High” column. The “Action” column will signal a “Sell” once the -7.5% point has been taken out in the “Off High” column.
- Trend Tracking Indexes (TTIs)
Our Trend Tracking Indexes (TTIs) were mixed with only the International one showing signs of life.
Here’s how we closed 11/1/2017:
Domestic TTI: +3.22% (last close +3.22%)—Buy signal effective 4/4/2016
International TTI: +6.68% (last close +6.42%)—Buy signal effective 7/19/2016
Disclosure: I am obliged to inform you that I, as well as my advisory clients, own some of the ETFs listed in the above table. Furthermore, they do not represent a specific investment recommendation for you, they merely show which ETFs from the universe I track are falling within the guidelines specified.
Contact Ulli