
ETF Tracker StatSheet
https://theetfbully.com/2017/11/weekly-statsheet-etf-tracker-newsletter-updated-11222017/
CLOSING AT NEW ALL-TIME HIGHS
- Moving the markets
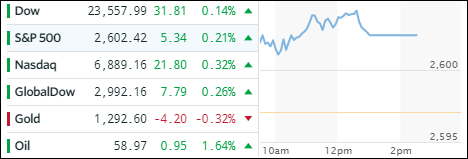
Despite this being a Holiday shortened week, 2 of the 3 major indexes (S&P 500 and Nasdaq) managed to close at new records with the S&P booking a gain of +0.9% over the past 4 sessions. Retailers were obviously in focus, but the retail ETF (XRT) closed down -0.43%, however, we will have to wait and see if Black Friday really turns into the game changer the industry has been hoping for.
Across the ETF space, we saw predominantly gains but also some losses. Closing solidly in the green were Semiconductors (SMH +0.83%), followed by International Equities (SCHF +0.73%) and International SmallCaps (SCHC +0.49%). On the downside, we saw Emerging Markets (SCHE -0.28%) and Transportations (IYT -0.05%).
Interest rates were mixed but the 10-year bond yield rose 2 basis points to end the week at 2.34%. Oil rallied, gold pulled back and the US Dollar (UUP) took another dive and gapped down -0.45% to lows last seen in September.
- ETFs in the Spotlight (updated for 2017)
In case you missed the announcement and description of this section, you can read it here again.
It features 10 broadly diversified and sector ETFs from my HighVolume list as posted every Saturday. Furthermore, they are screened for the lowest MaxDD% number meaning they have been showing better resistance to temporary sell offs than all others over the past year.
The below table simply demonstrates the magnitude with which some of the ETFs are fluctuating in regards to their positions above or below their respective individual trend lines (%M/A). A break below, represented by a negative number, shows weakness, while a break above, represented by a positive percentage, shows strength.
For hundreds of ETF choices, be sure to reference Thursday’s StatSheet.
Year to date, here’s how the 2017 candidates have fared so far:
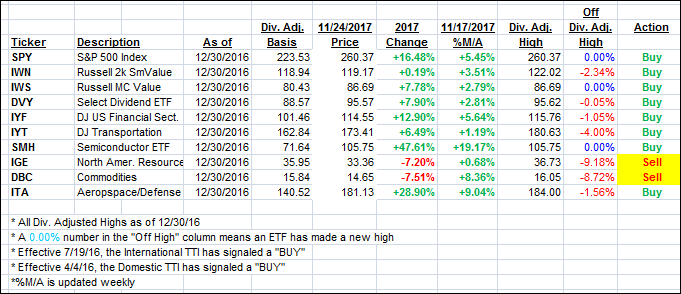
Again, the %M/A column above shows the position of the various ETFs in relation to their respective long term trend lines, while the trailing sell stops are being tracked in the “Off High” column. The “Action” column will signal a “Sell” once the -7.5% point has been taken out in the “Off High” column.
- Trend Tracking Indexes (TTIs)
Our Trend Tracking Indexes (TTIs) ended mixed despite the major indexes closing the week in the green.
Here’s how we closed 11/24/2017:
Domestic TTI: +3.38% above its M/A (last close +3.41%)—Buy signal effective 4/4/2016
International TTI: +6.21% above its M/A (last close +6.18%)—Buy signal effective 7/19/2016
Disclosure: I am obliged to inform you that I, as well as my advisory clients, own some of the ETFs listed in the above table. Furthermore, they do not represent a specific investment recommendation for you, they merely show which ETFs from the universe I track are falling within the guidelines specified.
————————————————————-
READER Q & A FOR THE WEEK
All Reader Q & A’s are listed at our web site!
Check it out at:
https://theetfbully.com/questions-answers/
———————————————————-
WOULD YOU LIKE TO HAVE YOUR INVESTMENTS PROFESSIONALLY MANAGED?
Do you have the time to follow our investment plans yourself? If you are a busy professional who would like to have his portfolio managed using our methodology, please contact me directly or get more details at:
https://theetfbully.com/personal-investment-management/
———————————————————
Back issues of the ETF/No Load Fund Tracker are available on the web at:
https://theetfbully.com/newsletter-archives/
Contact Ulli