
- Moving the markets
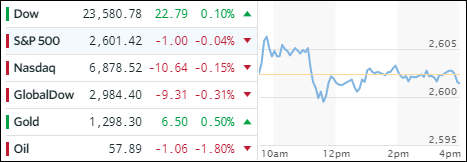
Right after the opening bell, the major indexes stormed into record territory but succumbed mid-day and turned this session into a non-event with only the Dow clinging on to close in the green. Despite warnings about the market’s lengthy run without a meaningful correction, traders focused on technical factors supporting their bullish view such as that the S&P 500 has been firmly entrenched above its 200-day M/A for the last year. Actually, the last time the S&P came within striking distance of breaking below it was February 2016.
The mixed picture continued in ETF space as well where we saw more losers than winners. Closing barely in the green was the Dividend ETF (SCHD +0.10%) and Aerospace & Defense (ITA +0.06%). On the downside, Semiconductors (SMH) were leading with -1.55% followed by Emerging Markets (SCHE -0.92%) and International SmallCaps (SCHC -0.73%).
While interest rates were mixed most of the action happened in the High Yield market which, after having rebounded the past 6 trading days, showed signs of weakness (higher rates), as HYG headed south again and lost -0.31%. Gold climbed all the way up to $1,299 until manipulation set in, and the yellow metal was pushed down again. The US dollar (UUP) made a V-shape recovery, after early losses, and gained +0.12%.
- ETFs in the Spotlight (updated for 2017)
In case you missed the announcement and description of this section, you can read it here again.
It features 10 broadly diversified and sector ETFs from my HighVolume list as posted every Saturday. Furthermore, they are screened for the lowest MaxDD% number meaning they have been showing better resistance to temporary sell offs than all others over the past year.
The below table simply demonstrates the magnitude with which some of the ETFs are fluctuating in regards to their positions above or below their respective individual trend lines (%M/A). A break below, represented by a negative number, shows weakness, while a break above, represented by a positive percentage, shows strength.
For hundreds of ETF choices, be sure to reference Thursday’s StatSheet.
Year to date, here’s how the 2017 candidates have fared so far:
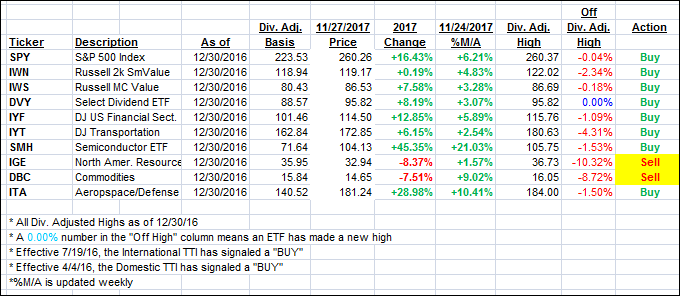
Again, the %M/A column above shows the position of the various ETFs in relation to their respective long term trend lines, while the trailing sell stops are being tracked in the “Off High” column. The “Action” column will signal a “Sell” once the -7.5% point has been taken out in the “Off High” column.
- Trend Tracking Indexes (TTIs)
Our Trend Tracking Indexes (TTIs) slipped a tad as the major indexes were mixed.
Here’s how we closed 11/27/2017:
Domestic TTI: +3.33% above its M/A (last close +3.38%)—Buy signal effective 4/4/2016
International TTI: +5.84% above its M/A (last close +6.21%)—Buy signal effective 7/19/2016
Disclosure: I am obliged to inform you that I, as well as my advisory clients, own some of the ETFs listed in the above table. Furthermore, they do not represent a specific investment recommendation for you, they merely show which ETFs from the universe I track are falling within the guidelines specified.
Contact Ulli