
- Moving the Markets
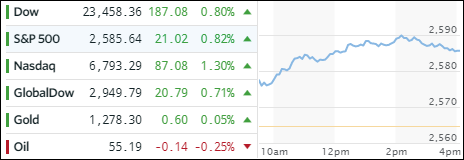
After skidding two days in a row, the major indexes bounced back and erased their recent losses with the S&P ending the session at the same level where we closed on Monday. Giving an assist was the widely expected passage of the tax bill in the House. That in itself is progress but not much of a reason to cheer since bipartisan support is conspicuously absent making it very likely that the final version will look much different.
Be that as it may, for today Wall Street traders were happy and pushed equities higher with the Nasdaq finishing at a new record. The ETFs we are invested in fared well; especially Semiconductors (SMH) galloped higher and gained a chest pounding +2.48%. Other impressive advancers were Emerging Markets (SCHE +1.77%), Transportations (IYT +1.68%) and US SmallCaps (SCHA +1.28%). The low ETF on the totem pole was Financials (XLF) with +0.04%.
Interest rates rose with the 10-year bond yield crawling 4 basis points higher to 2.37% causing the 20-year bond price (TLT) to slip -0.87%. On the other side of the spectrum, namely in High Yield Space, things reversed dramatically with HYG gapping higher and spiking +0.98% thereby wiping out 6 days of losses. The US Dollar moved in a tight range and managed to eke out a tiny +0.12% gain.
- ETFs in the Spotlight (updated for 2017)
In case you missed the announcement and description of this section, you can read it here again.
It features 10 broadly diversified and sector ETFs from my HighVolume list as posted every Saturday. Furthermore, they are screened for the lowest MaxDD% number meaning they have been showing better resistance to temporary sell offs than all others over the past year.
The below table simply demonstrates the magnitude with which some of the ETFs are fluctuating in regards to their positions above or below their respective individual trend lines (%M/A). A break below, represented by a negative number, shows weakness, while a break above, represented by a positive percentage, shows strength.
For hundreds of ETF choices, be sure to reference Thursday’s StatSheet.
Year to date, here’s how the 2017 candidates have fared so far:
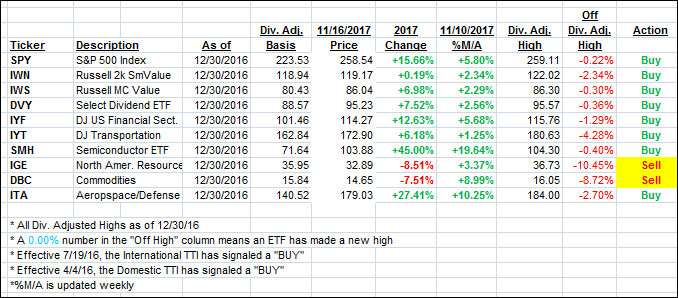
Again, the %M/A column above shows the position of the various ETFs in relation to their respective long term trend lines, while the trailing sell stops are being tracked in the “Off High” column. The “Action” column will signal a “Sell” once the -7.5% point has been taken out in the “Off High” column.
- Trend Tracking Indexes (TTIs)
Our Trend Tracking Indexes (TTIs) recovered and headed north.
Here’s how we closed 11/16/2017:
Domestic TTI: +3.14% above its M/A (last close +2.73%)—Buy signal effective 4/4/2016
International TTI: +5.65% above its M/A (last close +4.98%)—Buy signal effective 7/19/2016
Disclosure: I am obliged to inform you that I, as well as my advisory clients, own some of the ETFs listed in the above table. Furthermore, they do not represent a specific investment recommendation for you, they merely show which ETFs from the universe I track are falling within the guidelines specified.
Contact Ulli