
- Moving the Markets
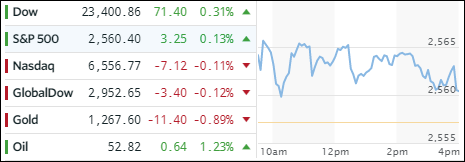
Some better than expected corporate earnings helped the major indexes to shake off yesterday’s bearish mood and remain above the unchanged line with the exception of the Nasdaq, which slipped a tad. Helping the markets was news that the House of Representatives squeezed out a budget bill allowing the Senate to later pass a tax reform package with a simple majority instead of 60 votes.
The predominant trend for the session was sideways, which was reflected in modest ETF performance. Yesterday’s loser, namely Transportations (IYT) came roaring back with a +0.94% showing and outclassing Semiconductors (SMH) with +0.54%. MidCaps (SCHM) had a nice session as well with a gain of +0.41%. On the losing side, we saw Aerospace & Defense (ITA) give back -0.85%.
The yield on the 10-year bond rose again by 2 basis points to 2.46%, its highest level in 7 months. It is now honing in on the high for the year (2.62%), which was made in March. I will be watching the rise in yields closely, as they eventually will become a threat to equities. As a consequence of higher rates, the US dollar (UUP) benefited and sprinted sharply higher by gaining +1.07% to reach its highest point since July.
- ETFs in the Spotlight (updated for 2017)
In case you missed the announcement and description of this section, you can read it here again.
It features 10 broadly diversified and sector ETFs from my HighVolume list as posted every Saturday. Furthermore, they are screened for the lowest MaxDD% number meaning they have been showing better resistance to temporary sell offs than all others over the past year.
The below table simply demonstrates the magnitude with which some of the ETFs are fluctuating in regards to their positions above or below their respective individual trend lines (%M/A). A break below, represented by a negative number, shows weakness, while a break above, represented by a positive percentage, shows strength.
For hundreds of ETF choices, be sure to reference Thursday’s StatSheet.
Year to date, here’s how the 2017 candidates have fared so far:
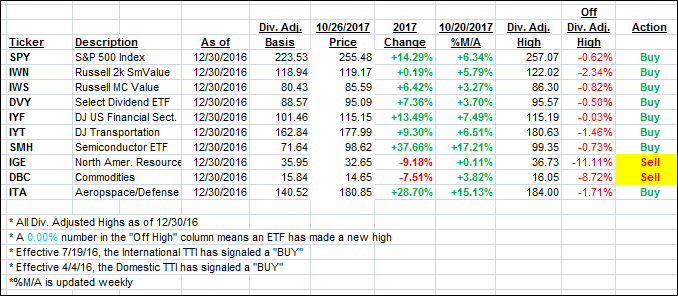
Again, the %M/A column above shows the position of the various ETFs in relation to their respective long term trend lines, while the trailing sell stops are being tracked in the “Off High” column. The “Action” column will signal a “Sell” once the -7.5% point has been taken out in the “Off High” column.
- Trend Tracking Indexes (TTIs)
Our Trend Tracking Indexes (TTIs) showed a mixed picture with the Domestic one rising and the International one falling.
Here’s how we closed 10/26/2017:
Domestic TTI: +2.74% (last close +2.57%)—Buy signal effective 4/4/2016
International TTI: +6.12% (last close +6.34%)—Buy signal effective 7/19/2016
Disclosure: I am obliged to inform you that I, as well as my advisory clients, own some of the ETFs listed in the above table. Furthermore, they do not represent a specific investment recommendation for you, they merely show which ETFs from the universe I track are falling within the guidelines specified.
Contact Ulli