
- Moving the Markets
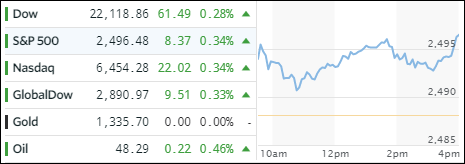
After yesterday’s massive rebound, the major indexes continued with their bullish theme supported by Treasury Secretary Mnuchin’s words that he’s hopeful a tax overhaul can be accomplished by the end of the year. He also hinted that they’re considering backdating any reform to the beginning of 2017. That’s all it took, and stocks ended at record highs, although in zigzag fashion, however, without ever touching the unchanged line.
The Dow ended in the green, but would have done so with far more conviction had it not been for weakness in McDonalds (-3.22%) and Apple (-0.40%), the latter of which managed to wipe out most of its early losses, as the new iPhone launch could not meet hyped up expectations as problems with the facial recognition feature and delayed ship dates were found to be upsetting.
In the ETF equity arena, we saw SmallCaps (SCHA) take the lead with a gain of +0.67%, with Transportations (IYT) taking a close second by adding +0.61%. Emerging Markets (SCHE) and Aerospace & Defense (ITA) showed the only red numbers, namely –0.07% and -0.21% respectively.
The dead cat bounce in Treasury yields continued with the 10-year rising 3 basis points to 2.17%. That took the bullish steam out of the 20-year bond price (TLT), which sank -0.53%. The US dollar index (UUP) traded in a tight range and gave back a modest -0.04% joined by gold, which retreated -0.22% to close at $1,333.
- ETFs in the Spotlight (updated for 2017)
In case you missed the announcement and description of this section, you can read it here again.
It features 10 broadly diversified and sector ETFs from my HighVolume list as posted every Saturday. Furthermore, they are screened for the lowest MaxDD% number meaning they have been showing better resistance to temporary sell offs than all others over the past year.
The below table simply demonstrates the magnitude with which some of the ETFs are fluctuating in regards to their positions above or below their respective individual trend lines (%M/A). A break below, represented by a negative number, shows weakness, while a break above, represented by a positive percentage, shows strength.
For hundreds of ETF choices, be sure to reference Thursday’s StatSheet.
Year to date, here’s how the 2017 candidates have fared so far:
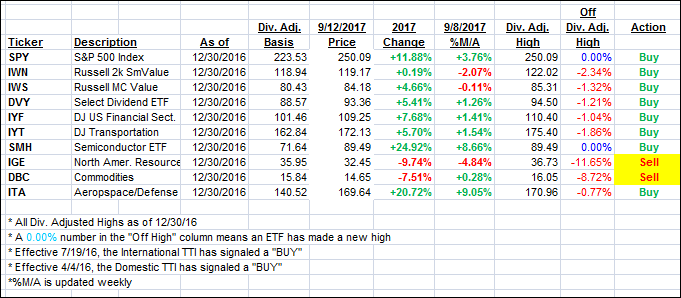
Again, the %M/A column above shows the position of the various ETFs in relation to their respective long term trend lines, while the trailing sell stops are being tracked in the “Off High” column. The “Action” column will signal a “Sell” once the -7.5% point has been taken out in the “Off High” column.
- Trend Tracking Indexes (TTIs)
Our Trend Tracking Indexes (TTIs) continued their upward bounce as the bulls remained in charge.
Here’s how we closed 9/12/2017:
Domestic TTI: +2.91% (last close +2.82%)—Buy signal effective 4/4/2016
International TTI: +7.35% (last close +6.92%)—Buy signal effective 7/19/2016
Disclosure: I am obliged to inform you that I, as well as my advisory clients, own some of the ETFs listed in the above table. Furthermore, they do not represent a specific investment recommendation for you, they merely show which ETFs from the universe I track are falling within the guidelines specified.
Contact Ulli