
- Moving the Markets
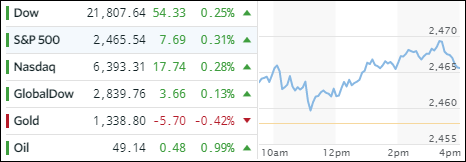
The markets were in rally mode, albeit modest, right after the opening bell and never looked back with the S&P 500 gaining +0.31%. Contributing to today’s bullish mood was some de-escalation with N. Korea, as Trump announced that “war was not first priority,” before agreeing to a 3-month debt-ceiling-can-kicking extension deal ending on December 15.
With more hurricanes on the horizon, energy recovered with crude oil gaining +0.99% and XLE scoring a solid +1.63%. Equity ETFs behaved nicely and closed higher with the leaders being the International arena (SCHF) with +0.62% and International SmallCaps (SCHC) with +0.57%. The losers of the day turned out to be Aerospace & Defense (ITA) with -0.73%, which was obviously due to reduced verbal saber rattling, joined by Gold with -0.42%.
Interest rates reversed from yesterday with the 20-year bond giving back -0.61%. The US Dollar (UUP) dipped lower but managed to rebound to almost wipe out all losses by closing down only a meager -0.08%.
- ETFs in the Spotlight (updated for 2017)
In case you missed the announcement and description of this section, you can read it here again.
It features 10 broadly diversified and sector ETFs from my HighVolume list as posted every Saturday. Furthermore, they are screened for the lowest MaxDD% number meaning they have been showing better resistance to temporary sell offs than all others over the past year.
The below table simply demonstrates the magnitude with which some of the ETFs are fluctuating in regards to their positions above or below their respective individual trend lines (%M/A). A break below, represented by a negative number, shows weakness, while a break above, represented by a positive percentage, shows strength.
For hundreds of ETF choices, be sure to reference Thursday’s StatSheet.
Year to date, here’s how the 2017 candidates have fared so far:
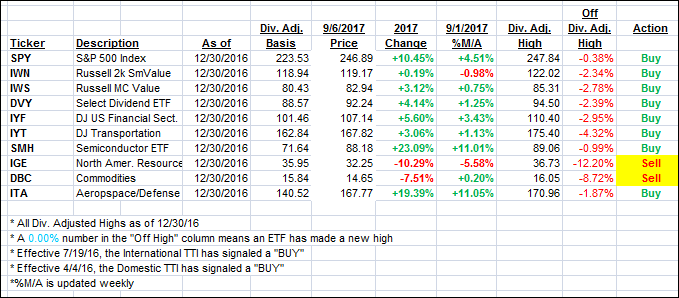
Again, the %M/A column above shows the position of the various ETFs in relation to their respective long term trend lines, while the trailing sell stops are being tracked in the “Off High” column. The “Action” column will signal a “Sell” once the -7.5% point has been taken out in the “Off High” column.
- Trend Tracking Indexes (TTIs)
Our Trend Tracking Indexes (TTIs) rebounded and showed modest gains.
Here’s how we closed 9/6/2017:
Domestic TTI: +2.65% (last close +2.56%)—Buy signal effective 4/4/2016
International TTI: +5.89% (last close +5.75%)—Buy signal effective 7/19/2016
Disclosure: I am obliged to inform you that I, as well as my advisory clients, own some of the ETFs listed in the above table. Furthermore, they do not represent a specific investment recommendation for you, they merely show which ETFs from the universe I track are falling within the guidelines specified.
Contact Ulli