
- Moving the Markets
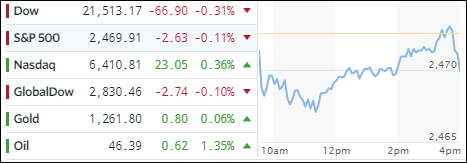
It was a nip and tuck kind of day with a rise in bond yields keeping any equity advances in check as hope prevailed that its impact on stocks would be ephemeral. The yield on the 10-year bond rose 2 basis points to 2.26% after having declined from a recent high of 2.39% set in early July.
The Nasdaq managed to shake off broad market uncertainty and finished the session in record territory by adding +0.36%. All eyes remain on upcoming earnings with nearly 200 S&P 500 companies being scheduled to show their report card this week.
Across all markets, it was a quiet day. The transportation index (IYT) headed south again as the VIX crashed to a new record closing low confirming total complacency in investor sentiment. The retail sector slipped with XRT losing -1.49%, but the financials (XLF) managed to eke out a gain of +0.36%. Both, the US dollar and gold, meandered all day but went nowhere.
The Fed is scheduled to begin its 2-day meeting on interest rates tomorrow but, while no change in rates is expected, the linguistic experts on Wall Street will surely dissect the Wednesday statement for any clues as to when the Fed intents to reduce its $4.5 trillion balance sheet.
- ETFs in the Spotlight (updated for 2017)
In case you missed the announcement and description of this section, you can read it here again.
It features 10 broadly diversified and sector ETFs from my HighVolume list as posted every Saturday. Furthermore, they are screened for the lowest MaxDD% number meaning they have been showing better resistance to temporary sell offs than all others over the past year.
The below table simply demonstrates the magnitude with which some of the ETFs are fluctuating in regards to their positions above or below their respective individual trend lines (%M/A). A break below, represented by a negative number, shows weakness, while a break above, represented by a positive percentage, shows strength.
For hundreds of ETF choices, be sure to reference Thursday’s StatSheet.
Year to date, here’s how the 2017 candidates have fared so far:
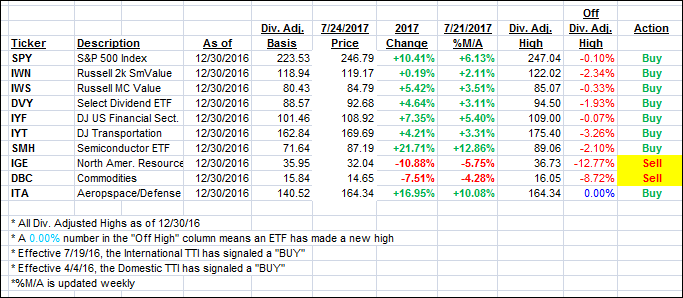
Again, the %M/A column above shows the position of the various ETFs in relation to their respective long term trend lines, while the trailing sell stops are being tracked in the “Off High” column. The “Action” column will signal a “Sell” once the -7.5% point has been taken out in the “Off High” column.
- Trend Tracking Indexes (TTIs)
Our Trend Tracking Indexes (TTIs) showed a mixed picture with the Domestic one gaining and the International one losing.
Here’s how we closed 7/24/2017:
Domestic TTI: +3.72% (last close +3.68%)—Buy signal effective 4/4/2016
International TTI: +8.21% (last close +8.36%)—Buy signal effective 7/19/2016
Disclosure: I am obliged to inform you that I, as well as my advisory clients, own some of the ETFs listed in the above table. Furthermore, they do not represent a specific investment recommendation for you, they merely show which ETFs from the universe I track are falling within the guidelines specified.
Contact Ulli