
- Moving the Markets
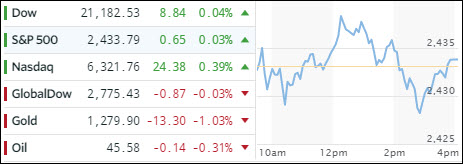
You could say that the much anticipated “big” Thursday turned into a dud as far as the Comey testimony was concerned. While the markets whipsawed throughout the day, in the end, the major indexes closed above the unchanged line. The Dow touched new record territory before dipping into the red after which it reclaimed positive ground.
SmallCaps (IWN) were on fire and gained +1.60%, which was their 2nd biggest day in over 3 months, while the semiconductors (SMH) showed a great performance as well by scoring +1.35%. Financials joined the party and outperformed with XLF adding +1.15% for the day. When there are winners, there must be losers. Today, it was utilities, which had their worst day in 3 months.
Crude oil slipped again and came dangerously close to dropping below the $45 handle. Interest rates rose with the 10-year Treasury bond now yielding +2.18%, a nice bounce off the recent lows. The US dollar climbed higher for the second day in a row with UUP gaining +0.36%, but the longer downtrend remains intact.
- ETFs in the Spotlight (updated for 2017)
In case you missed the announcement and description of this section, you can read it here again.
It features 10 broadly diversified and sector ETFs from my HighVolume list as posted every Saturday. Furthermore, they are screened for the lowest MaxDD% number meaning they have been showing better resistance to temporary sell offs than all others over the past year.
The below table simply demonstrates the magnitude with which some of the ETFs are fluctuating in regards to their positions above or below their respective individual trend lines (%M/A). A break below, represented by a negative number, shows weakness, while a break above, represented by a positive percentage, shows strength.
For hundreds of ETF choices, be sure to reference Thursday’s StatSheet.
Year to date, here’s how the 2017 candidates have fared so far:
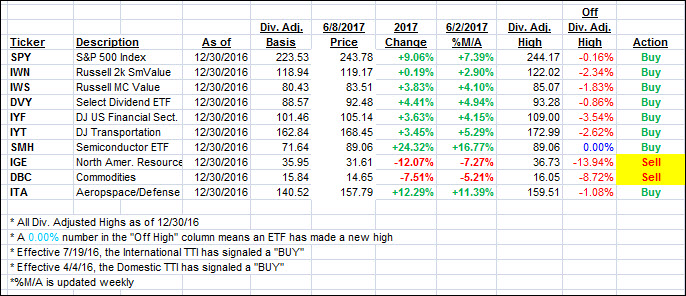
Again, the %M/A column above shows the position of the various ETFs in relation to their respective long term trend lines, while the trailing sell stops are being tracked in the “Off High” column. The “Action” column will signal a “Sell” once the -7.5% point has been taken out in the “Off High” column.
- Trend Tracking Indexes (TTIs)
Our Trend Tracking Indexes (TTIs) again moved insignificantly, as the major indexes whipsawed but went essentially sideways.
Here’s how we closed 6/8/2017:
Domestic TTI: +4.10% (last close +4.08%)—Buy signal effective 4/4/2016
International TTI: +8.39% (last close +8.31%)—Buy signal effective 7/19/2016
Disclosure: I am obliged to inform you that I, as well as my advisory clients, own some of the ETFs listed in the above table. Furthermore, they do not represent a specific investment recommendation for you, they merely show which ETFs from the universe I track are falling within the guidelines specified.
Contact Ulli