
ETF Tracker StatSheet
https://theetfbully.com/2017/04/weekly-statsheet-etf-tracker-newsletter-updated-04272017/
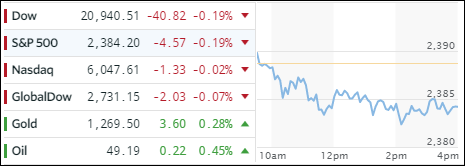
MARKETS EKE OUT A GAIN DURING THE LAST WEEK OF THE MONTH
- Moving the Markets
The aimless meandering to the downside during the first 3 weeks of April is now in the rear view mirror as the last 5 trading days combined to pull the markets above the unchanged line for the month, or +0.9% in the case of the S&P 500. This week turned out to be the best for stocks for the year, although volume was abysmal for the past two days.
Hard to make some sense out of that fact as economic performance, when measured by the GDP, collapsed to an embarrassing 0.7%; and that is the officially admitted number, which makes me wonder if the real one is still on the positive side of the ledger.
In the end, technology was April’s winner, energy turned into the big laggard, while the Dollar index headed south for the 2nd month in a row. As I mentioned before, the banks continued slipping and are down ever since Trump announced his tax plan. Interestingly, the 30-year yield hit its glass ceiling (the 3.00% level) five times this week without breaking through confirming the theme that higher rates continue to be on the horizon.
- ETFs in the Spotlight (updated for 2017)
In case you missed the announcement and description of this section, you can read it here again.
It features 10 broadly diversified and sector ETFs from my HighVolume list as posted every Saturday. Furthermore, they are screened for the lowest MaxDD% number meaning they have been showing better resistance to temporary sell offs than all others over the past year.
The below table simply demonstrates the magnitude with which some of the ETFs are fluctuating in regards to their positions above or below their respective individual trend lines (%M/A). A break below, represented by a negative number, shows weakness, while a break above, represented by a positive percentage, shows strength.
For hundreds of ETF choices, be sure to reference Thursday’s StatSheet.
Year to date, here’s how the 2017 candidates have fared so far:
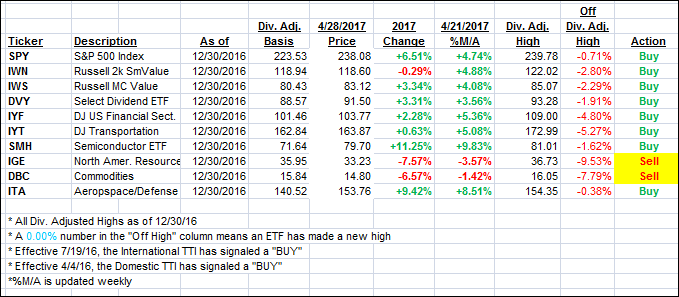
Again, the %M/A column above shows the position of the various ETFs in relation to their respective long term trend lines, while the trailing sell stops are being tracked in the “Off High” column. The “Action” column will signal a “Sell” once the -7.5% point has been taken out in the “Off High” column.
- Trend Tracking Indexes (TTIs)
Our Trend Tracking Indexes (TTIs) slipped as the major indexes stumbled into the last day of the month.
Here’s how we closed 4/28/2017:
Domestic TTI: +3.14% (last close +3.32%)—Buy signal effective 4/4/2016
International TTI: +6.91% (last close +7.36%)—Buy signal effective 7/19/2016
Disclosure: I am obliged to inform you that I, as well as my advisory clients, own some of the ETFs listed in the above table. Furthermore, they do not represent a specific investment recommendation for you, they merely show which ETFs from the universe I track are falling within the guidelines specified.
————————————————————-
READER Q & A FOR THE WEEK
All Reader Q & A’s are listed at our web site!
Check it out at:
https://theetfbully.com/questions-answers/
———————————————————-
WOULD YOU LIKE TO HAVE YOUR INVESTMENTS PROFESSIONALLY MANAGED?
Do you have the time to follow our investment plans yourself? If you are a busy professional who would like to have his portfolio managed using our methodology, please contact me directly or get more details at:
https://theetfbully.com/personal-investment-management/
———————————————————
Back issues of the ETF/No Load Fund Tracker are available on the web at:
https://theetfbully.com/newsletter-archives/
Contact Ulli