
- Moving the Markets
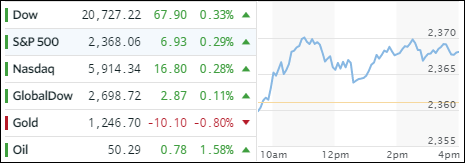
The US dollar rallied for the 3rd day in a row (+0.54%) and conquered its psychologically important 100 level. The main support came from the latest 4th quarter 2016 GDP upward revision from 1.9% to 2.1%, which may help the dollar to notch its first weekly advance in three.
Crude Oil joined the upward thrust by adding +1.58% and reclaiming the $50 barrier for the first time in a couple of weeks. Who knows how long that will last as this move was based on the latest jawboning by Kuwait’s oil minister in regards to talks on extending production cuts. Yes, we’ve seen that movie before, and we know how it ends.
It appeared that the Trump trade, which showed signs of weakening throughout most of March, was back on today as some of the recent “weaklings” like transports and small caps managed to gain the most. Banks as well ended to the plus side, interest rates rose with the 10-year Treasury yield ending at 2.42%, while gold headed south and lost -0.80%.
The question in my mind is whether today was just an aberration attributable to quarter-ending window dressing or a return to the Trump trade. I don’t think we’ll find out tomorrow, the last day of the month, but we might get a better idea next week if today’s upward momentum has legs.
- ETFs in the Spotlight (updated for 2017)
In case you missed the announcement and description of this section, you can read it here again.
It features 10 broadly diversified and sector ETFs from my HighVolume list as posted every Saturday. Furthermore, they are screened for the lowest MaxDD% number meaning they have been showing better resistance to temporary sell offs than all others over the past year.
The below table simply demonstrates the magnitude with which some of the ETFs are fluctuating in regards to their positions above or below their respective individual trend lines (%M/A). A break below, represented by a negative number, shows weakness, while a break above, represented by a positive percentage, shows strength.
For hundreds of ETF choices, be sure to reference Thursday’s StatSheet.
Year to date, here’s how the 2017 candidates have fared so far:
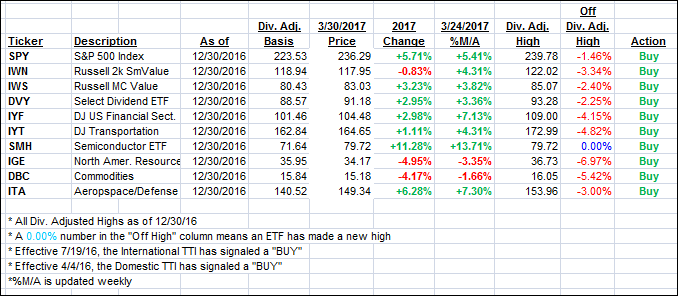
Again, the %M/A column above shows the position of the various ETFs in relation to their respective long term trend lines, while the trailing sell stops are being tracked in the “Off High” column. The “Action” column will signal a “Sell” once the -7.5% point has been taken out in the “Off High” column.
- Trend Tracking Indexes (TTIs)
Our Trend Tracking Indexes (TTIs) headed further north as the major indexes were in rally mode.
Here’s how we closed 3/30/2017:
Domestic TTI: +2.69% (last close +2.44%)—Buy signal effective 4/4/2016
International TTI: +5.81% (last close +5.73%)—Buy signal effective 7/19/2016
Disclosure: I am obliged to inform you that I, as well as my advisory clients, own some of the ETFs listed in the above table. Furthermore, they do not represent a specific investment recommendation for you, they merely show which ETFs from the universe I track are falling within the guidelines specified.
Contact Ulli