
ETF Tracker StatSheet
https://theetfbully.com/2017/02/weekly-statsheet-etf-tracker-newsletter-updated-02092017/
Trump’s Tax Talk Boosts Markets
- Moving the Markets
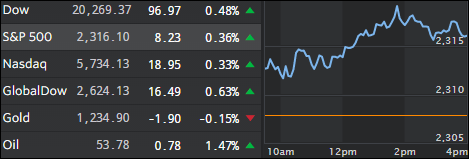
Yesterday’s theme of renewed optimism caused by Trump’s tax talk continued through today’s session with the major indexes rising to all-time closing highs, although the gains were less than the day before. The only fly in the ointment was that volumes have decreasing as the indexes have been rising, which makes this rally a little suspect.
Additionally, volatility for the S&P 500 has been crushed to its lowest in 10 years; we have now had 85 days in a row without a 1% drop, 44 days without a 1% close to close gain or loss and 39 days without a 1% intra-day swing. These are not signs of a normal market but of a manipulated market.
Nevertheless, the bullish trend continues for the time being with today’s support coming from a spike in oil prices, which pushed the energy sector higher. All eyes continue to be on Trump next week as we are sure to see more announcements, some of which may give a further assist to the equity markets.
- ETFs in the Spotlight (updated for 2017)
In case you missed the announcement and description of this section, you can read it here again.
It features 10 broadly diversified and sector ETFs from my HighVolume list as posted every Saturday. Furthermore, they are screened for the lowest MaxDD% number meaning they have been showing better resistance to temporary sell offs than all others over the past year.
The below table simply demonstrates the magnitude with which some of the ETFs are fluctuating in regards to their positions above or below their respective individual trend lines (%M/A). A break below, represented by a negative number, shows weakness, while a break above, represented by a positive percentage, shows strength.
For hundreds of ETF choices, be sure to reference Thursday’s StatSheet.
Year to date, here’s how the 2017 candidates have fared so far:
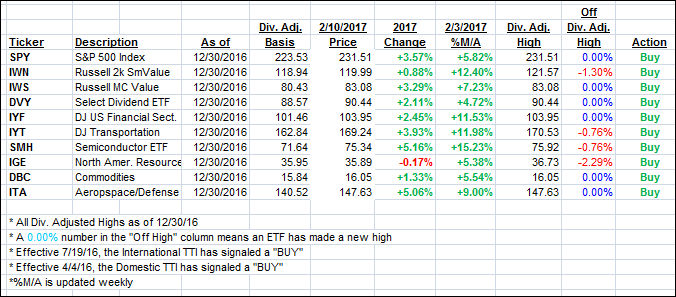
Again, the %M/A column above shows the position of the various ETFs in relation to their respective long term trend lines, while the trailing sell stops are being tracked in the “Off High” column. The “Action” column will signal a “Sell” once the -7.5% point has been taken out in the “Off High” column.
- Trend Tracking Indexes (TTIs)
Our Trend Tracking Indexes (TTIs) inched up on the back of the continued rally caused by Trump’s tax surprise announcement with details to be released in a couple of weeks.
Here’s how we closed 2/10/2017:
Domestic TTI: +2.42% (last close +2.39%)—Buy signal effective 4/4/2016
International TTI: +4.81% (last close +4.73%)—Buy signal effective 7/19/2016
Disclosure: I am obliged to inform you that I, as well as my advisory clients, own some of the ETFs listed in the above table. Furthermore, they do not represent a specific investment recommendation for you, they merely show which ETFs from the universe I track are falling within the guidelines specified.
————————————————————-
READER Q & A FOR THE WEEK
All Reader Q & A’s are listed at our web site!
Check it out at:
https://theetfbully.com/questions-answers/
———————————————————-
WOULD YOU LIKE TO HAVE YOUR INVESTMENTS PROFESSIONALLY MANAGED?
Do you have the time to follow our investment plans yourself? If you are a busy professional who would like to have his portfolio managed using our methodology, please contact me directly or get more details at:
https://theetfbully.com/personal-investment-management/
———————————————————
Back issues of the ETF/No Load Fund Tracker are available on the web at:
https://theetfbully.com/newsletter-archives/
Contact Ulli