
- Moving the Markets
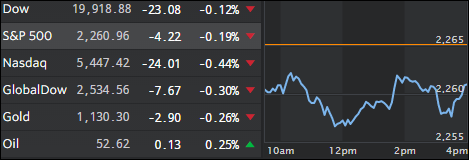
The major indexes never managed to crawl above the unchanged line during today’s session in part caused by weakness in retailers. Stocks fell after reports that Trump’s transition team is mulling over a possible 10% tariff on imports with the Consumer Discretionaries losing over 1% for the day, their largest one-day decline since October.
We have reached a point in the markets where the post-election gains seem to have made them very expensive considering that all is based on hype and hope. What happens if Congress ends up not just watering down some of Trump’s ideas but rejects others outright?
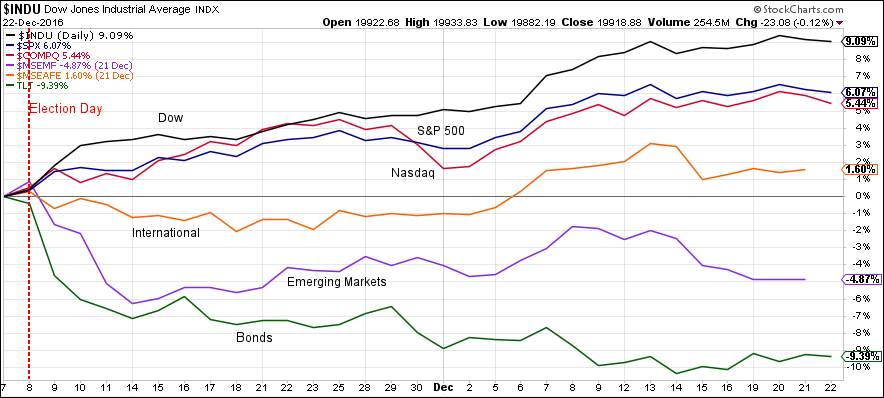
To be realistic, we really need to see first what will actually get passed before these recent gains can be justified. Speaking of those gains, they were not broad based when looking at it from a global basis, but more focused on U.S. equities while bonds, at the same time, got hammered. The following chart makes this abundantly clear:
 Click on chart to enlarge
As you can clearly see, most of the gains were made in domestic U.S. equities, while the International and Emerging market arenas lagged behind. If you had a conservative 50/50 allocation of bonds and U.S stocks in your portfolio, you made nothing as the loss on bonds more than offset the gain in equities.
- ETFs in the Spotlight
In case you missed the announcement and description of this section, you can read it here again.
It features 10 broadly diversified ETFs from my HighVolume list as posted every Saturday. Furthermore, they are screened for the lowest MaxDD% number meaning they have been showing better resistance to temporary sell offs than all others over the past year.
Here are the 10 candidates:
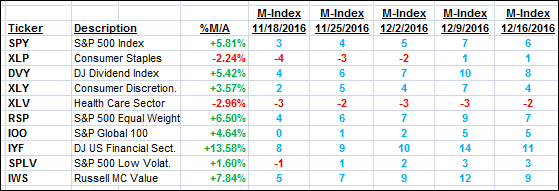
The above table simply demonstrates the magnitude with which some of the ETFs are fluctuating in regards to their positions above or below their respective individual trend lines (%M/A). A break below, represented by a negative number, shows weakness, while a break above, represented by a positive percentage, shows strength.
For hundreds of ETF choices, be sure to reference Thursday’s StatSheet.
Year to date, here’s how the above candidates have fared so far:
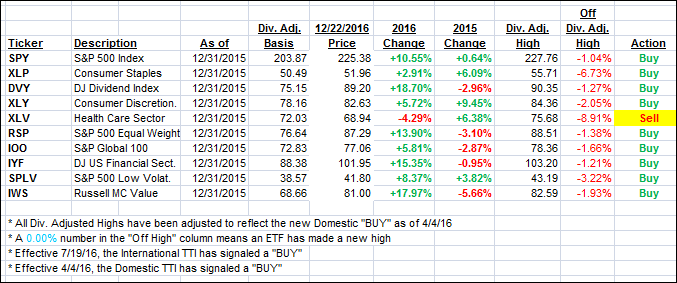
Again, the first table above shows the position of the various ETFs in relation to their respective long term trend lines (%M/A), while the second one tracks their trailing sell stops in the “Off High” column. The “Action” column will signal a “Sell” once the -7.5% point has been taken out in the “Off High” column.
- Trend Tracking Indexes (TTIs)
Our Trend Tracking Indexes (TTIs) slipped again as weak retail data kept the major indexes below the unchanged line.
Here’s how we closed 12/22/2016:
Domestic TTI: +1.24% (last close +1.39%)—Buy signal effective 4/4/2016
International TTI: +2.28% (last close +2.50%)—Buy signal effective 7/19/2016
Disclosure: I am obliged to inform you that I, as well as my advisory clients, own some of the ETFs listed in the above table. Furthermore, they do not represent a specific investment recommendation for you, they merely show which ETFs from the universe I track are falling within the guidelines specified.
Contact Ulli