
1. Moving the Markets
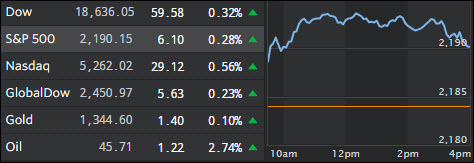
U.S. stocks hit record highs today for the second time since 1999. The Dow Jones Industrial Average rose 0.3% to close at 18,636.05. The Standard & Poor’s 500 index rose 6.10 points to close at 2,190.15 and the Nasdaq composite index gained +0.56% to finish at 5,262.02 in the stock market today. Again, as I pointed out Friday, while this makes for great headline reading, the fact is the major indexes are not racing into record territory, but stumbling slowly higher supported only by Fed policy. Volume was the lowest of the year and there was no broad based participation.
Energy stocks had the strongest performance among major industry sectors as oil prices ticked upward. The Dow Jones U.S. Oil & Gas index outperformed with a 0.8% gain. West Texas Intermediate crude oil rose 2.8% to $45.74 a barrel and Brent Crude Oil rose 2.9% to $48.35 a barrel as speculation over the reports that OPEC allegedly is considering a production cut or freeze.
In other markets, European stocks were flat, while Asian markets closed mostly higher with Chinese stocks helped by a pending announcement for the launch of a trading link between the Chinese stock exchanges in Shenzhen and Hong Kong.
2. ETFs in the Spotlight
In case you missed the announcement and description of this section, you can read it here again.
It features 10 broadly diversified ETFs from my HighVolume list as posted every Monday. Furthermore, they are screened for the lowest MaxDD% number meaning they have been showing better resistance to temporary sell offs than all others over the past year.
Here are the 10 candidates:
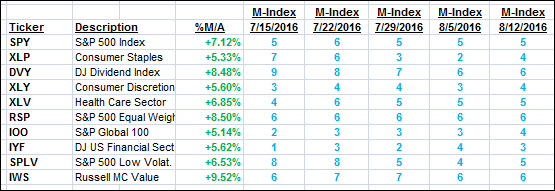
The above table simply demonstrates the magnitude with which some of the ETFs are fluctuating in regards to their positions above or below their respective individual trend lines (%M/A). A break below, represented by a negative number, shows weakness, while a break above, represented by a positive percentage, shows strength.
For hundreds of ETF choices, be sure to reference Thursday’s StatSheet.
Year to date, here’s how the above candidates have fared so far:
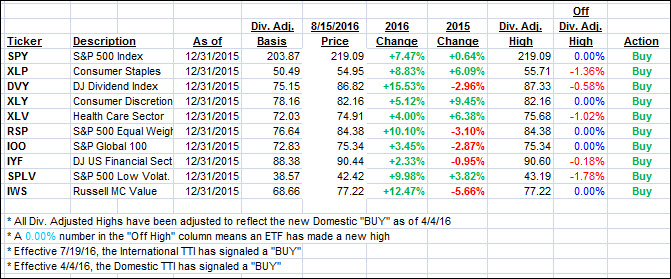
Again, the first table above shows the position of the various ETFs in relation to their respective long term trend lines (%M/A), while the second one tracks their trailing sell stops in the “Off High” column. The “Action” column will signal a “Sell” once the -7.5% point has been taken out in the “Off High” column.
3. Trend Tracking Indexes (TTIs)
Our Trend Tracking Indexes (TTIs) both moved higher as a sharp rally in US oil contributed to strength in the major indexes.
Here’s how we ended up on 8/15/2016:
Domestic TTI: +3.22% (last close +3.11%)—Buy signal effective 4/4/2016
International TTI: +4.92% (last close +4.68%)—Buy signal effective 7/19/2016
Disclosure: I am obliged to inform you that I, as well as my advisory clients, own some of the ETFs listed in the above table. Furthermore, they do not represent a specific investment recommendation for you, they merely show which ETFs from the universe I track are falling within the guidelines specified.
Contact Ulli