
1. Moving the Markets
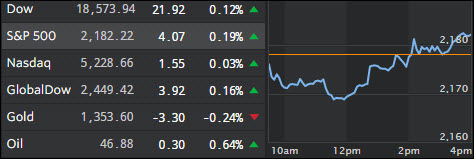
Falling in line with the (as of lately) market topping then dropping phenomena, all three indexes pushed higher again today…barely. Stocks here in the U.S. stretched into positive territory late in the day after Fed Minutes news suggested that an interest rate hike may still be on the table for calendar year 2016.
In usual fashion, Fed officials still appear to be largely divided on whether the economy is strong enough to warrant a rate hike. Alleged recent economic strength, most notably the jobs report in July, has added fuel to the growing suspicion that the Fed could move to slow things down. During July, employers added 255,000 predominantly part-time jobs, which are supposed to be a strong showing for the second-straight month.
Though Wall Street might be pleased at the prospect of low interest rates for a longer period, some sectors are hurting. Today, the retail sector suffered another round of blows as home improvement retailer Lowe’s (LOW) posted disappointing earnings and big-box chain Target lowered its outlook, bludgeoning stocks of both companies.
2. ETFs in the Spotlight
In case you missed the announcement and description of this section, you can read it here again.
It features 10 broadly diversified ETFs from my HighVolume list as posted every Monday. Furthermore, they are screened for the lowest MaxDD% number meaning they have been showing better resistance to temporary sell offs than all others over the past year.
Here are the 10 candidates:
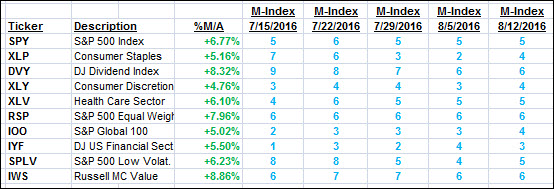
The above table simply demonstrates the magnitude with which some of the ETFs are fluctuating in regards to their positions above or below their respective individual trend lines (%M/A). A break below, represented by a negative number, shows weakness, while a break above, represented by a positive percentage, shows strength.
For hundreds of ETF choices, be sure to reference Thursday’s StatSheet.
Year to date, here’s how the above candidates have fared so far:
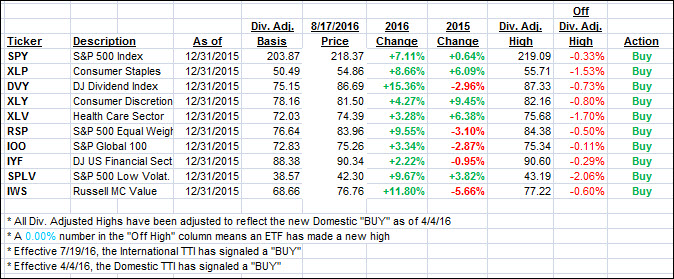
Again, the first table above shows the position of the various ETFs in relation to their respective long term trend lines (%M/A), while the second one tracks their trailing sell stops in the “Off High” column. The “Action” column will signal a “Sell” once the -7.5% point has been taken out in the “Off High” column.
3. Trend Tracking Indexes (TTIs)
Our Trend Tracking Indexes (TTIs) barely moved as the major indexes were battling to conquer the unchanged line.
Here’s how we closed on 8/17/2016:
Domestic TTI: +3.02% (last close +2.96%)—Buy signal effective 4/4/2016
International TTI: +4.67% (last close +4.69%)—Buy signal effective 7/19/2016
Disclosure: I am obliged to inform you that I, as well as my advisory clients, own some of the ETFs listed in the above table. Furthermore, they do not represent a specific investment recommendation for you, they merely show which ETFs from the universe I track are falling within the guidelines specified.
Contact Ulli