
1. Moving the Markets
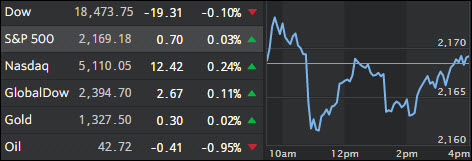
U.S. stocks ended mixed Tuesday as investors digested a mixed batch of earnings reports and as the Federal Reserve kicked off a two-day meeting on interest rates. As you can see in the above S&P chart, stocks dropped sharply during mid-day about 0.75%, but were pushed back up since, with the Fed in charge of market direction, market pullbacks of more than 0.3% appear to be no longer “allowed” in this “new” trading environment…
In earnings news, McDonald’s (MCD) contributed to the Dow’s decline today after the fast-food giant reported earnings that missed Wall Street estimates and posted disappointing sales numbers. Shares fell 4.4%. Shares of Verizon (VZ) fell 1.9% after the telecomm company said a worker strike in the spring hurt its second-quarter results. United Technologies (UTX) raised its outook for the year and reported earnings and revenue that beat estimates. Shares were up 2.7%. Dupont (DD) shares rose 0.7% after cost-cutting helped boost profits that beat expectations for the chemical company.
In auto news today, we finally heard the verdict today regarding Volkswagen’s environmental scandal. Volkswagen Group will pay up to $14.7 billion in a sweeping settlement that includes compensation for owners for its polluting diesel-powered cars, environmental mitigation and funds to promote zero-emissions cars. Owners of the 475,000 Volkswagen vehicles with 2-liter diesels covered under the settlement will receive payments ranging from $5,100 to $10,000 if they agree to the settlement.
More earnings reports are due this week from both S&P 500 and Dow companies, as well as the Friday economics report, but on deck for tomorrow is the widely anticipated outcome of the Fed meeting on interest rates. My guess is “no change.”
2. ETFs in the Spotlight
In case you missed the announcement and description of this section, you can read it here again.
It features 10 broadly diversified ETFs from my HighVolume list as posted every Monday. Furthermore, they are screened for the lowest MaxDD% number meaning they have been showing better resistance to temporary sell offs than all others over the past year.
Here are the 10 candidates:
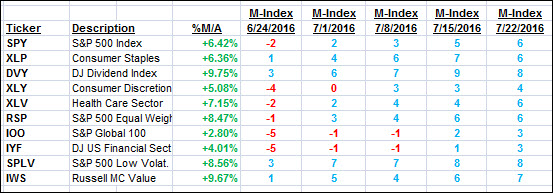
The above table simply demonstrates the magnitude with which some of the ETFs are fluctuating in regards to their positions above or below their respective individual trend lines (%M/A). A break below, represented by a negative number, shows weakness, while a break above, represented by a positive percentage, shows strength.
For hundreds of ETF/Mutual fund choices, be sure to reference Thursday’s StatSheet.
Year to date, here’s how the above candidates have fared so far:
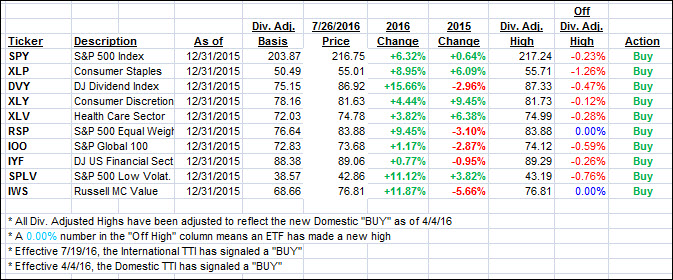
Again, the first table above shows the position of the various ETFs in relation to their respective long term trend lines (%M/A), while the second one tracks their trailing sell stops in the “Off High” column. The “Action” column will signal a “Sell” once the -7.5% point has been taken out in the “Off High” column.
3. Trend Tracking Indexes (TTIs)
Both of our Trend Tracking Indexes (TTIs) inched up a tad as the S&P 500 had some wild intra-day swings but closed just about unchanged most likely in anticipation of the Fed’s meeting on interest rates.
Here’s how we closed on 7/26/2016:
Domestic TTI: +2.72% (last close +2.67%)—Buy signal effective 4/4/2016
International TTI: +2.45% (last close +2.30%)—Buy signal effective 7/19/2016
Disclosure: I am obliged to inform you that I, as well as advisory clients of mine, own some of these listed ETFs. Furthermore, they do not represent a specific investment recommendation for you, they merely show which ETFs from the universe I track are falling within the guidelines specified.
Contact Ulli