
1. Moving the Markets
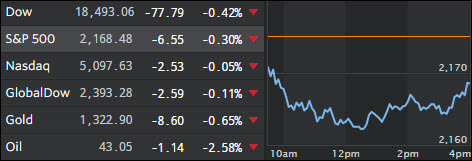
After ending last week at a record high, the U.S. stock market pulled back Monday ahead of a week that features a big onslaught of corporate earnings results, a key meeting on interest rates and a barrage of fresh economic data.
Stocks are riding high on four straight weeks of gains, driven by a better-than-expected start to the Q2 earnings season, continued propaganda that the U.S. economy is holding up following Britain’s vote to exit the Eurozone, and hopes among investors that central bankers from around the globe will continue to be supportive, which at this time is a given.
In earnings, nearly 200 companies in the S&P 500 are due to release quarterly profits this week. Thus far, about 68% of the 26% of companies have reported. However, even with the modest pick up in earnings, if only relative to expectations, “the blended earnings decline is still -3.7%, putting the quarter on pace for the fifth consecutive decline in earnings since Q3 2008 through Q3 2009”, as one analyst put it.
In M&A news, a winner was finally crowned for the takeover of Yahoo’s (YHOO) core business. That winner is Verizon (VZ). Verizon made the official announcement that it is paying $4.8 bil in cash. The telecomm giant will pair Yahoo with AOL, which it bought last May.
And on the economic front, anticipation will be high awaiting the first reading on second quarter economic growth after the first quarter of this year saw a disappointing 1.1% GDP. Tomorrow, we will get the latest data reading on new home sales and consumer confidence, and on Wednesday durable goods orders are set for release.
2. ETFs in the Spotlight
In case you missed the announcement and description of this section, you can read it here again.
It features 10 broadly diversified ETFs from my HighVolume list as posted every Monday. Furthermore, they are screened for the lowest MaxDD% number meaning they have been showing better resistance to temporary sell offs than all others over the past year.
Here are the 10 candidates:
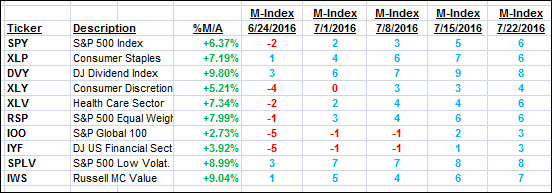
The above table simply demonstrates the magnitude with which some of the ETFs are fluctuating in regards to their positions above or below their respective individual trend lines (%M/A). A break below, represented by a negative number, shows weakness, while a break above, represented by a positive percentage, shows strength.
For hundreds of ETF/Mutual fund choices, be sure to reference Thursday’s StatSheet.
Year to date, here’s how the above candidates have fared so far:
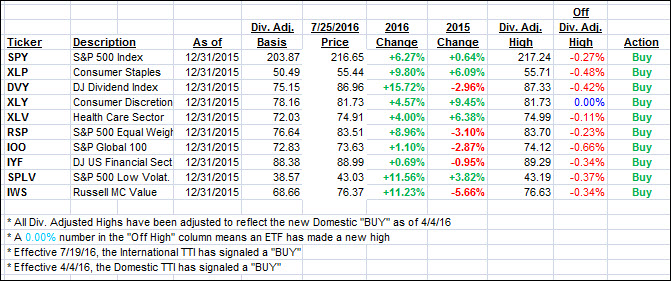
Again, the first table above shows the position of the various ETFs in relation to their respective long term trend lines (%M/A), while the second one tracks their trailing sell stops in the “Off High” column. The “Action” column will signal a “Sell” once the -7.5% point has been taken out in the “Off High” column.
3. Trend Tracking Indexes (TTIs)
Both of our Trend Tracking Indexes (TTIs) retreated as the major averages pulled back to start the week.
Here’s how we closed on 7/25/2016:
Domestic TTI: +2.67% (last close +2.85%)—Buy signal effective 4/4/2016
International TTI: +2.30% (last close +2.39%)—Buy signal effective 7/19/2016
Disclosure: I am obliged to inform you that I, as well as advisory clients of mine, own some of these listed ETFs. Furthermore, they do not represent a specific investment recommendation for you, they merely show which ETFs from the universe I track are falling within the guidelines specified.
Contact Ulli