
1. Moving the Markets
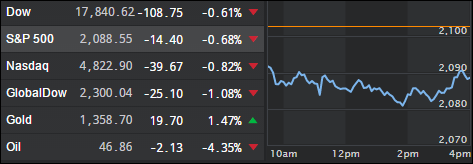
Stocks departed from their post-Brexit bounce and ended lower to kick off the shortened week here in the U.S. It appears that even after a long Holiday weekend the Brexit event is still lingering in geopolitical and financial news. All three major indexes closed at least 0.60% lower on the day.
Early on in the day, the Bank of England reduced the capital requirements of banks in an effort to keep credit flowing in the U.K. and the British pound remained under pressure, hitting a fresh 31-year low vs. the U.S. dollar. The pound was trading down 1.35% Tuesday.
In another sign of risk-averse mentality in markets, U.S.-produced crude dropped 4.41% to close at $46.83 a barrel and gold, a perceived haven in uncertain times, was up $11.40 an ounce to $1,350.40.
This shall be an interesting week of trading as investors not only await updated economic info regarding June performance in major industries across the board but also eagerly follow the meltdown of the Italian banks.
2. ETFs in the Spotlight
In case you missed the announcement and description of this section, you can read it here again.
It features 10 broadly diversified ETFs from my HighVolume list as posted every Monday. Furthermore, they are screened for the lowest MaxDD% number meaning they have been showing better resistance to temporary sell offs than all others over the past year.
Here are the 10 candidates:
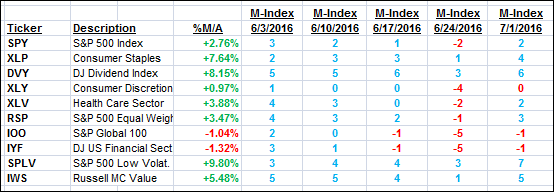
The above table simply demonstrates the magnitude with which some of the ETFs are fluctuating in regards to their positions above or below their respective individual trend lines (%M/A). A break below, represented by a negative number, shows weakness, while a break above, represented by a positive percentage, shows strength.
For hundreds of ETF/Mutual fund choices, be sure to reference Thursday’s StatSheet.
Year to date, here’s how the above candidates have fared so far:
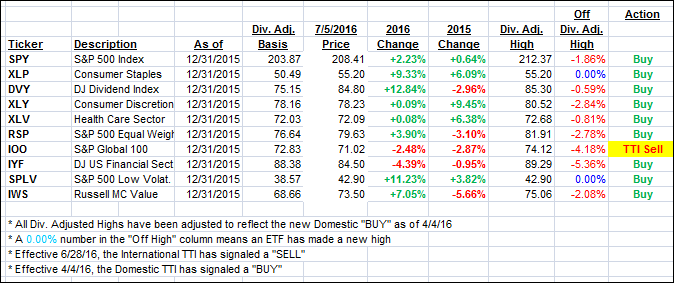
Again, the first table above shows the position of the various ETFs in relation to their respective long term trend lines (%M/A), while the second one tracks their trailing sell stops in the “Off High” column. The “Action” column will signal a “Sell” once the -7.5% point has been taken out in the “Off High” column.
3. Trend Tracking Indexes (TTIs)
Our Domestic Trend Tracking Index (TTI) slipped a tad while the International one took a dive after last week’s recovery. It seems that Europe is very concerned about the Italian banking system, which sits on $360 billion of non-performing loans. Ouch; that will not end well.
Here’s how we ended up:
Domestic TTI: +1.66% (last close +1.88%)—Buy signal effective 4/4/2016
International TTI: -2.00% (last close -0.73%)—Sell signal effective 6/28/2016
Disclosure: I am obliged to inform you that I, as well as advisory clients of mine, own some of these listed ETFs. Furthermore, they do not represent a specific investment recommendation for you, they merely show which ETFs from the universe I track are falling within the guidelines specified.
Contact Ulli