
1. Moving the Markets
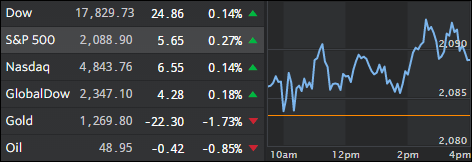
The U.S. stock market slightly extended its relief rally as Wall Street and other global financial markets continue to be dominated by the pending outcome of Britain’s vote on Thursday to leave or stay in the European Union.
In a sign of just how high-profile and potentially risky the “Brexit” vote is to financial markets, billionaire George Soros shifted into high gear fear mongering mode today opining that a vote by Britain to leave the EU could allegedly cause grave damage to the living standards in the U.K. and trigger a massive drop in the value of the British pound.
In tech, Apple (AAPL) may finally be integrating into the India marketplace. Potential sales in India prompted Apple CEO Tim Cook to visit the country for the first time last month, where he met with India Prime Minister Narendra Modi, financial and tech leaders, and consumers alike. Apple has built a $59 billion business in China, its second-largest market, but it is in India, with annual sales of $1.5 billion, where Cook & Co. see the most potential.
2. ETFs in the Spotlight
In case you missed the announcement and description of this section, you can read it here again.
It features 10 broadly diversified ETFs from my HighVolume list as posted every Monday. Furthermore, they are screened for the lowest MaxDD% number meaning they have been showing better resistance to temporary sell offs than all others over the past year.
Here are the 10 candidates:
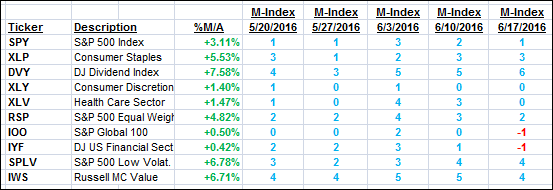
The above table simply demonstrates the magnitude with which some of the ETFs are fluctuating in regards to their positions above or below their respective individual trend lines (%M/A). A break below, represented by a negative number, shows weakness, while a break above, represented by a positive percentage, shows strength.
For hundreds of ETF/Mutual fund choices, be sure to reference Thursday’s StatSheet.
Year to date, here’s how the above candidates have fared so far:
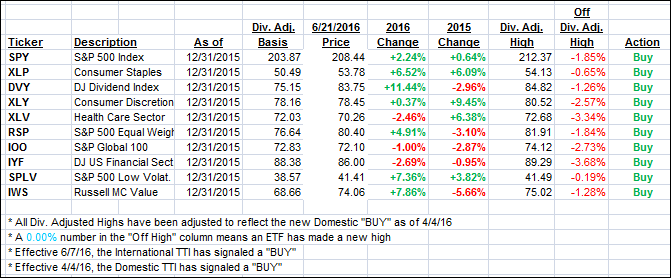
Again, the first table above shows the position of the various ETFs in relation to their respective long term trend lines (%M/A), while the second one tracks their trailing sell stops in the “Off High” column. The “Action” column will signal a “Sell” once the -7.5% point has been taken out in the “Off High” column.
3. Trend Tracking Indexes (TTIs)
Our Domestic Trend Tracking Index (TTI) stayed just about even while the International one dipped deeper into bullish territory. More volatily is sure in store for us as the Brexit vote nears (Thursday).
Here’s how we closed:
Domestic TTI: +1.58% (last close +1.57%)—Buy signal effective 4/4/2016
International TTI: +0.75% (last close +0.60%)—Buy signal effective 6/7/2016
Disclosure: I am obliged to inform you that I, as well as advisory clients of mine, own some of these listed ETFs. Furthermore, they do not represent a specific investment recommendation for you, they merely show which ETFs from the universe I track are falling within the guidelines specified.
Contact Ulli