
1. Moving the Markets
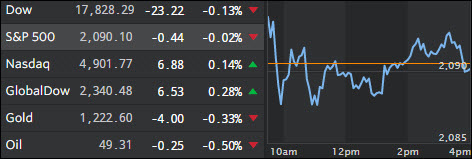
Stocks went nowhere and held steady as most assets decoupled and closed lower. ZH reports that USDYPY headed south as did oil, high yield bonds and Treasury yields while the major stock indexes stubbornly remained in nosebleed territory closing around the unchanged line. Volume was atrocious.
Banks were a drag on the markets with equities taking a breather after their best 2-day advance in about 2 months as the S&P 500 attempted, but failed, to regain its 2,100 level, a milestone that it lost back on April 20th.
While the Friday before Memorial Weekend is a notoriously slow day on Wall Street, this may not be the case tomorrow as Fed chief Yellen is scheduled to speak at an event in Massachusetts that may shed some light on the future path of interest rates. She’s set to talk 45 minutes before the markets shut down for 3 days.
2. ETFs in the Spotlight
In case you missed the announcement and description of this section, you can read it here again.
It features 10 broadly diversified ETFs from my HighVolume list as posted every Monday. Furthermore, they are screened for the lowest MaxDD% number meaning they have been showing better resistance to temporary sell offs than all others over the past year.
Here are the 10 candidates:
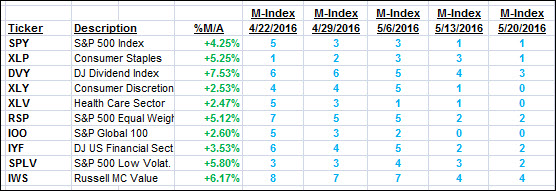
The above table simply demonstrates the magnitude with which some of the ETFs are fluctuating in regards to their positions above or below their respective individual trend lines (%M/A). A break below, represented by a negative number, shows weakness, while a break above, represented by a positive percentage, shows strength.
For hundreds of ETF/Mutual fund choices, be sure to reference Thursday’s StatSheet.
Year to date, here’s how the above candidates have fared so far:
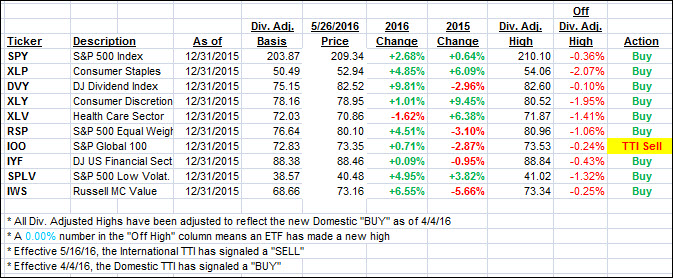
Again, the first table above shows the position of the various ETFs in relation to their respective long term trend lines (%M/A), while the second one tracks their trailing sell stops in the “Off High” column. The “Action” column will signal a “Sell” once the -7.5% point has been taken out in the “Off High” column.
3. Trend Tracking Indexes (TTIs)
Our Domestic Trend Tracking Index (TTI) inched higher with the International one following suit. Since the International TTI has just crossed its trend line to the upside a couple of days ago, I will continue to wait and see if more upward momentum develops before issuing a new Buy signal. The idea here is to try to avoid another whip-saw signal as that market is apparently stuck in an erratic sideways pattern.
Here’s how we closed:
Domestic TTI: +1.76% (last close +1.65%)—Buy signal effective 4/4/2016
International TTI: +1.01% (last close +0.75%)—Sell signal effective 5/16/2016
Disclosure: I am obliged to inform you that I, as well as advisory clients of mine, own some of these listed ETFs. Furthermore, they do not represent a specific investment recommendation for you, they merely show which ETFs from the universe I track are falling within the guidelines specified.
Contact Ulli