
1. Moving the Markets
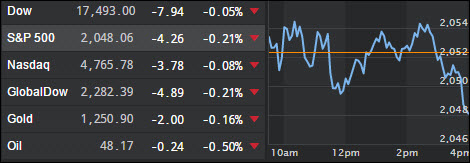
Markets were little changed at the closing bell as Wall Street continues to contemplate the (potential) interest rate hike in June and a lingering sluggish growth rate of the U.S. economy.
While Monday was quiet overall, investors are awaiting data on April new home sales Tuesday, as well as earnings results from auto parts retailer AutoZone (AZO) and TV and electronics retailer Best Buy (BBY).
In M&A news, we heard rumors today that GE is in the midst of making a number of deals with the United Arab Emirates as part of a plan to wean the country from its dependence on oil production. The tentative plan also calls for floating a stake in the world’s largest oil company, Saudi Arabian Oil Co., and setting up one of the world’s biggest government investment funds. Shares of GE closed slightly lower than par today.
We also heard today that German pharma giant Bayer AG (BAYRY) has offered an all cash bid of $62 billion for U.S. seed company Monsanto. Bayer would pay Monsanto shareholders $122 per share, which was a 37% premium over the closing price of $89.03 on May 9. Shares of Monsanto today gained 4.41% to close at $106.00 a share.
2. ETFs in the Spotlight
In case you missed the announcement and description of this section, you can read it here again.
It features 10 broadly diversified ETFs from my HighVolume list as posted every Monday. Furthermore, they are screened for the lowest MaxDD% number meaning they have been showing better resistance to temporary sell offs than all others over the past year.
Here are the 10 candidates:
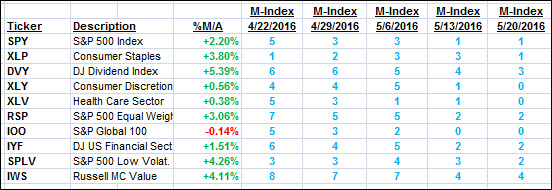
The above table simply demonstrates the magnitude with which some of the ETFs are fluctuating in regards to their positions above or below their respective individual trend lines (%M/A). A break below, represented by a negative number, shows weakness, while a break above, represented by a positive percentage, shows strength.
For hundreds of ETF/Mutual fund choices, be sure to reference Thursday’s StatSheet.
Year to date, here’s how the above candidates have fared so far:
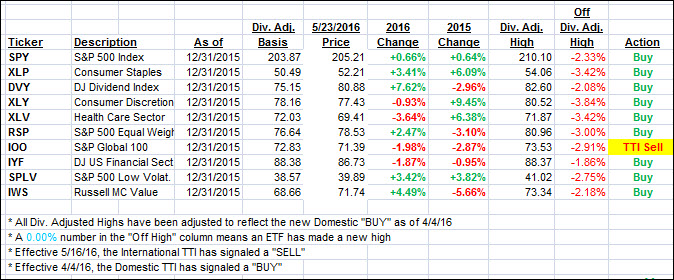
Again, the first table above shows the position of the various ETFs in relation to their respective long term trend lines (%M/A), while the second one tracks their trailing sell stops in the “Off High” column. The “Action” column will signal a “Sell” once the -7.5% point has been taken out in the “Off High” column.
3. Trend Tracking Indexes (TTIs)
Our Domestic Trend Tracking Index (TTI) slipped a tad and so did the International one. The markets went nowhere today and are in need of a driver to keep the bullish theme alive.
Here’s how we ended up:
Domestic TTI: +0.80% (last close +0.87%)—Buy signal effective 4/4/2016
International TTI: -0.98% (last close -0.91%)—Sell signal effective 5/16/2016
Disclosure: I am obliged to inform you that I, as well as advisory clients of mine, own some of these listed ETFs. Furthermore, they do not represent a specific investment recommendation for you, they merely show which ETFs from the universe I track are falling within the guidelines specified.
Contact Ulli