
1. Moving the Markets
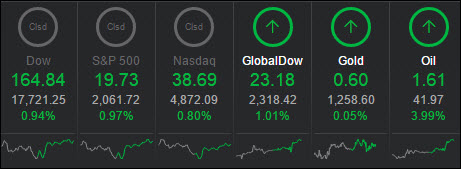
Stocks posted strong gains today, rising nearly 1% across the board.
Oil, as it has been (and seems like will be for the near future) was “the” big market mover. The black gold gained 3.96% to move above $41 a barrel, which makes economic bulls even more bullish.
In the world of ETFs, energy based funds are posting substantial gains on renewed hopes of cuts in oil production. There is an alleged meeting this week between major oil powers, the same type of story concerning reduced production we’ve heard about over and over again in the recent past. My guess is that this one will end like all the other ones: In disappointment.
Coming up in earnings this week, a dozen companies in the S&P 500 will report, including big banks such as JPMorgan Chase (JPM), Bank of America (BAC), Wells Fargo (WFC) and Citigroup (C). Expectations remain low, however, as profits are expected to contract more than 7% for S&P 500 companies.
Let’s see how the markets will respond to moving oil prices and the upcoming earnings reports this week.
2. ETFs in the Spotlight
In case you missed the announcement and description of this section, you can read it here again.
It features 10 broadly diversified ETFs from my HighVolume list as posted every Monday. Furthermore, they are screened for the lowest MaxDD% number meaning they have been showing better resistance to temporary sell offs than all others over the past year.
Here are the 10 candidates:
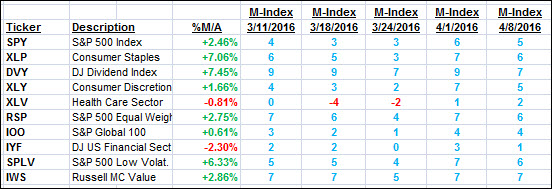
The above table simply demonstrates the magnitude with which some of the ETFs are fluctuating in regards to their positions above or below their respective individual trend lines (%M/A). A break below, represented by a negative number, shows weakness, while a break above, represented by a positive percentage, shows strength.
For hundreds of ETF/Mutual fund choices, be sure to reference Thursday’s StatSheet.
Year to date, here’s how the above candidates have fared so far:
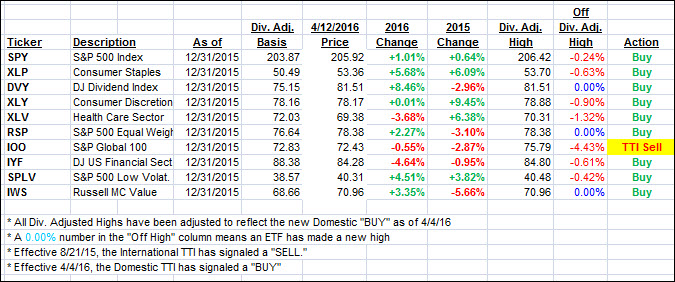
Again, the first table above shows the position of the various ETFs in relation to their respective long term trend lines (%M/A), while the second one tracks their trailing sell stops in the “Off High” column. The “Action” column will signal a “Sell” once the -7.5% point has been taken out in the “Off High” column.
3. Trend Tracking Indexes (TTIs)
Our Domestic Trend Tracking Index (TTI) improved and headed deeper into bullish territory.
Here’s how we ended up:
Domestic TTI: +1.31% (last close +1.05%)—Buy signal effective 4/4/2016
International TTI: -1.95% (last close -2.81%)—Sell signal effective 8/21/2015
Disclosure: I am obliged to inform you that I, as well as advisory clients of mine, own some of these listed ETFs. Furthermore, they do not represent a specific investment recommendation for you, they merely show which ETFs from the universe I track are falling within the guidelines specified.
Contact Ulli