
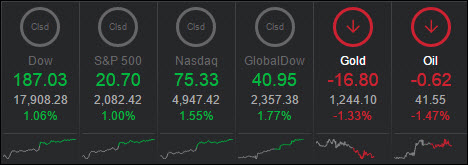
Markets soared higher today on strong earnings from JPMorgan that resulted in bullish sentiment on upcoming report cards for the financial sector. That’s the official MSM version.
Mine is that if you set the earnings bar low enough, the numbers can be beat, which happened today and resulted in a lift of share prices for the banking sector despite it being the worst start to a new year since the 2007-2008 crisis, as financial stocks dropped 5.6% for the quarter. Again, the very low bottom line was beat and nothing else mattered as shares of JP Morgan and American Express kept the rally alive. Let’s see if this theme continues when Bof A and Wells Fargo report on Thursday.
While retail sales data were absolutely horrific, it did not matter as the Fed opined that the domestic economy continues to plow ahead in a positive direction with solid advances in the labor market and housing offsetting a mixed performance in the manufacturing sector.
Consumer spending, which makes up 70% of economic activity, appeared to slow. But there were two possible bright spots: Slow wage growth appears to be picking up and business spending is generally expanding.
With earnings season getting underway, I am curious to see if the headline scanning computer algos will use any “beat” of the extremely low expectations to generate another rally. If so, we should be able to take out the all-time highs by the end of April; of course, I am being facetious here, but in this manipulated market environment you can never be sure.
2. ETFs in the Spotlight
In case you missed the announcement and description of this section, you can read it here again.
It features 10 broadly diversified ETFs from my HighVolume list as posted every Monday. Furthermore, they are screened for the lowest MaxDD% number meaning they have been showing better resistance to temporary sell offs than all others over the past year.
Here are the 10 candidates:
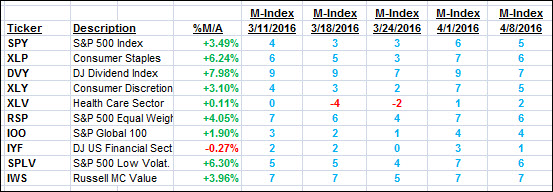
The above table simply demonstrates the magnitude with which some of the ETFs are fluctuating in regards to their positions above or below their respective individual trend lines (%M/A). A break below, represented by a negative number, shows weakness, while a break above, represented by a positive percentage, shows strength.
For hundreds of ETF/Mutual fund choices, be sure to reference Thursday’s StatSheet.
Year to date, here’s how the above candidates have fared so far:
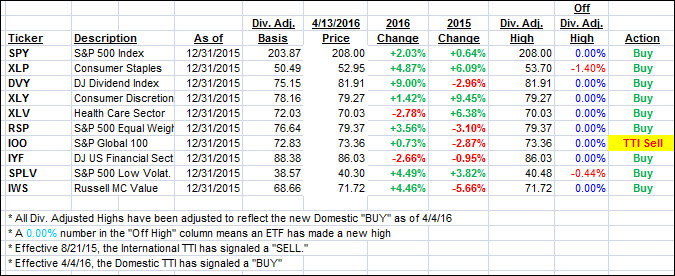
Again, the first table above shows the position of the various ETFs in relation to their respective long term trend lines (%M/A), while the second one tracks their trailing sell stops in the “Off High” column. The “Action” column will signal a “Sell” once the -7.5% point has been taken out in the “Off High” column.
3. Trend Tracking Indexes (TTIs)
Our Domestic Trend Tracking Index (TTI) rallied deeper into bullish territory followed by the International TTI, which is getting within striking distance to signaling a new “Buy” as well.
Here’s how we closed:
Domestic TTI: +1.80% (last close +1.31%)—Buy signal effective 4/4/2016
International TTI: -0.61% (last close -1.95%)—Sell signal effective 8/21/2015
Disclosure: I am obliged to inform you that I, as well as advisory clients of mine, own some of these listed ETFs. Furthermore, they do not represent a specific investment recommendation for you, they merely show which ETFs from the universe I track are falling within the guidelines specified.
Contact Ulli