
1. Moving the Markets
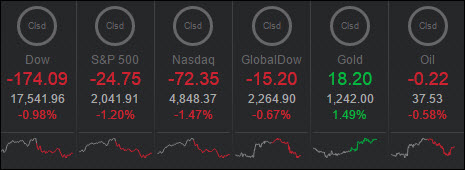
The bullish optimism that was powering stocks over the past month is fizzling. Caution and skepticism are poking holes in the sentiments, and the bears are slowly awakening from hibernation it seems. Whether it will be enough to end our recent Buy signal remains to be seen.
Oil has resumed its decline, dropping 2.6% to $36.77 a barrel, and investors are still on the edge of their seats awaiting corporate earnings, which aren’t expected to be strong. However, the bar has been set so low that some companies ought to be able to beat those expectations and help keep the bullish dream alive.
Of course, the Federal Reserve said last month that it only plans to hike interest rates two times this year – not four. And the minutes of its March meeting suggest a rate hike this month isn’t likely. Still, uncertainty related to the Fed’s plans still persist as strong jobs data in the U.S. collides with risks from abroad, low inflation and a recent slowdown in U.S. economic growth.
Let’s see what the markets can do tomorrow to round out the week!
2. ETFs in the Spotlight
In case you missed the announcement and description of this section, you can read it here again.
It features 10 broadly diversified ETFs from my HighVolume list as posted every Monday. Furthermore, they are screened for the lowest MaxDD% number meaning they have been showing better resistance to temporary sell offs than all others over the past year.
Here are the 10 candidates:
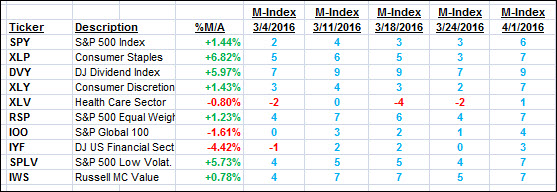
The above table simply demonstrates the magnitude with which some of the ETFs are fluctuating in regards to their positions above or below their respective individual trend lines (%M/A). A break below, represented by a negative number, shows weakness, while a break above, represented by a positive percentage, shows strength.
For hundreds of ETF/Mutual fund choices, be sure to reference Thursday’s StatSheet.
Year to date, here’s how the above candidates have fared so far:
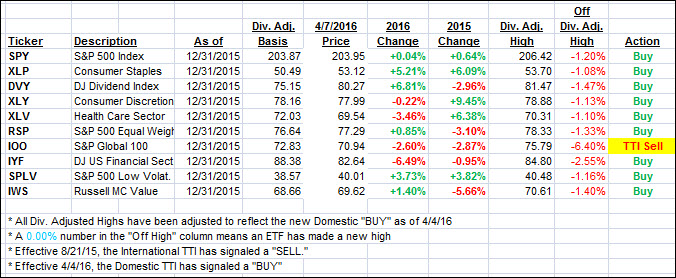
Again, the first table above shows the position of the various ETFs in relation to their respective long term trend lines (%M/A), while the second one tracks their trailing sell stops in the “Off High” column. The “Action” column will signal a “Sell” once the -7.5% point has been taken out in the “Off High” column.
3. Trend Tracking Indexes (TTIs)
Our Domestic Trend Tracking Index (TTI) slipped as the major indexes shifted back into reverse. Since the effective date of our new Domestic Buy signal last Monday, the markets have been going sideways and seem to be in need of a driver. It’s wide open at this point if the upcoming earnings season can provide enough hope to create the illusion that all is well.
Here’s how we ended up:
Domestic TTI: +1.08% (last close +1.49%)—Buy signal effective 4/4/2016
International TTI: -3.80% (last close -2.83%)—Sell signal effective 8/21/2015
Disclosure: I am obliged to inform you that I, as well as advisory clients of mine, own some of these listed ETFs. Furthermore, they do not represent a specific investment recommendation for you, they merely show which ETFs from the universe I track are falling within the guidelines specified.
Contact Ulli